<?xml version="1.0" encoding="utf-8"?><feed xmlns="http://www.w3.org/2005/Atom" ><generator uri="https://jekyllrb.com/" version="3.10.0">Jekyll</generator><link href="https://failingfast.io/feed.xml" rel="self" type="application/atom+xml" /><link href="https://failingfast.io/" rel="alternate" type="text/html" /><updated>2026-08-08T12:22:00+01:00</updated><id>https://failingfast.io/feed.xml</id><title type="html">Failing Fast</title><subtitle>...</subtitle><author><name>Ben Hall</name></author><entry><title type="html">Epistemic Debt: The Hidden Cost of AI Speed</title><link href="https://failingfast.io/ai-epistemic-debt/" rel="alternate" type="text/html" title="Epistemic Debt: The Hidden Cost of AI Speed" /><published>2026-01-10T00:00:00+00:00</published><updated>2026-01-10T00:00:00+00:00</updated><id>https://failingfast.io/invisible-tax-ai-code</id><content type="html" xml:base="https://failingfast.io/ai-epistemic-debt/"><![CDATA[<p class="notice--primary"><strong>TL;DR:</strong> Epistemic debt is what happens when you ship code you can’t explain. AI creates an illusion of competence: code that looks professional, tests that pass, but without the understanding you need to debug, extend, or defend it later.</p>

<p>“Write code faster”. Managers see cycle time. Developers are divided. Some see glorified autocomplete; others see “amateur hour”. I’m in the camp that sees the beginning of engineers as leaders: less time typing code, more time defining intent and managing risk - and if you generate 1,000 lines of code in a few seconds, you have not just solved a problem, you have created a maintenance obligation.</p>

<p>AI is part of my everyday workflow now. At its best, it scales my work: it can pick up a half-finished thread after a week away, and it gives me a kind of semantic map of a codebase.</p>

<p>Not “search” as in grep. More like: <em>trace how concept X flows through the system</em>, <em>show me every call site that can trigger behaviour Y</em>, <em>where is this validated / transformed / logged</em>, and <em>what else would a change here plausibly break</em>. Questions like that used to take a ticket and a block of time. Now it’s seconds.</p>

<p>And separately: it turns ideas into something I can look at. For me as an (<a href="https://en.wikipedia.org/wiki/Aphantasia">aphant</a>), that externalising step is a super productivity boost.</p>

<p>At its worst, it is confidently wrong in ways that look tidy. I spend a lot of time steering it away from dodgy abstractions and subtle breakage. I’m able to spot that because I’ve made those mistakes myself.</p>

<p>I have written before about the <a href="/the-real-cost-of-ai-coding-tools/">economic and environmental costs</a> of the infrastructure itself. But the other bill, the one your team pays directly, arrives as <strong>review time</strong>, <strong>churn</strong>, and <strong>security flaws</strong>.</p>

<h2 id="the-defining-challenge-epistemic-debt">The defining challenge: epistemic debt</h2>

<p><strong>Epistemic debt is what happens when you ship code you can’t explain.</strong> Not technical debt from shortcuts - this is the <em>illusion of competence</em>. Code that looks professional, tests that pass, but without the understanding to maintain it.</p>

<p>I have caught myself here. Deep in the flow, the model starts doing more than filling in syntax: it begins choosing the shape of the solution. You still feel like you are “writing code” because you’re nudging and iterating, but your role has quietly shifted from <em>driving</em> to <em>supervising</em>.</p>

<p>The danger is not that you’re rubber-stamping. It’s that the handover of control is gradual enough that you only notice later - when you need to explain the change or debug a weird edge case, and you realise you haven’t built the mental model.</p>

<p class="pull-quote">If you can’t explain it, you didn’t ship a solution - you shipped a mystery.</p>

<p>Bugs happen in hand-written code too. The difference is recovery cost. When you write the change, you usually build a mental model as you go: what it assumes, what it touches, and where it is fragile.</p>

<p>With AI, the work shifts. You become the reviewer of a draft you did not author. That can be fine, but only if someone still does the ‘authoring work’ - internalising the change.</p>

<p><strong>Shipping code is taking responsibility for its behaviour.</strong> If you can’t explain what a change does, what it assumes, and how it can fail, you don’t really own it. AI doesn’t remove that obligation - it increases the amount of code you can produce, which makes the ownership requirement more important, not less.</p>

<h2 id="why-epistemic-debt-amplifies-every-other-risk">Why epistemic debt amplifies every other risk</h2>

<p>Epistemic debt matters because when you don’t understand what you’ve shipped, you can’t spot problems lurking beneath the surface. It makes every traditional software risk worse:</p>

<h3 id="1-the-churn">1. The churn</h3>

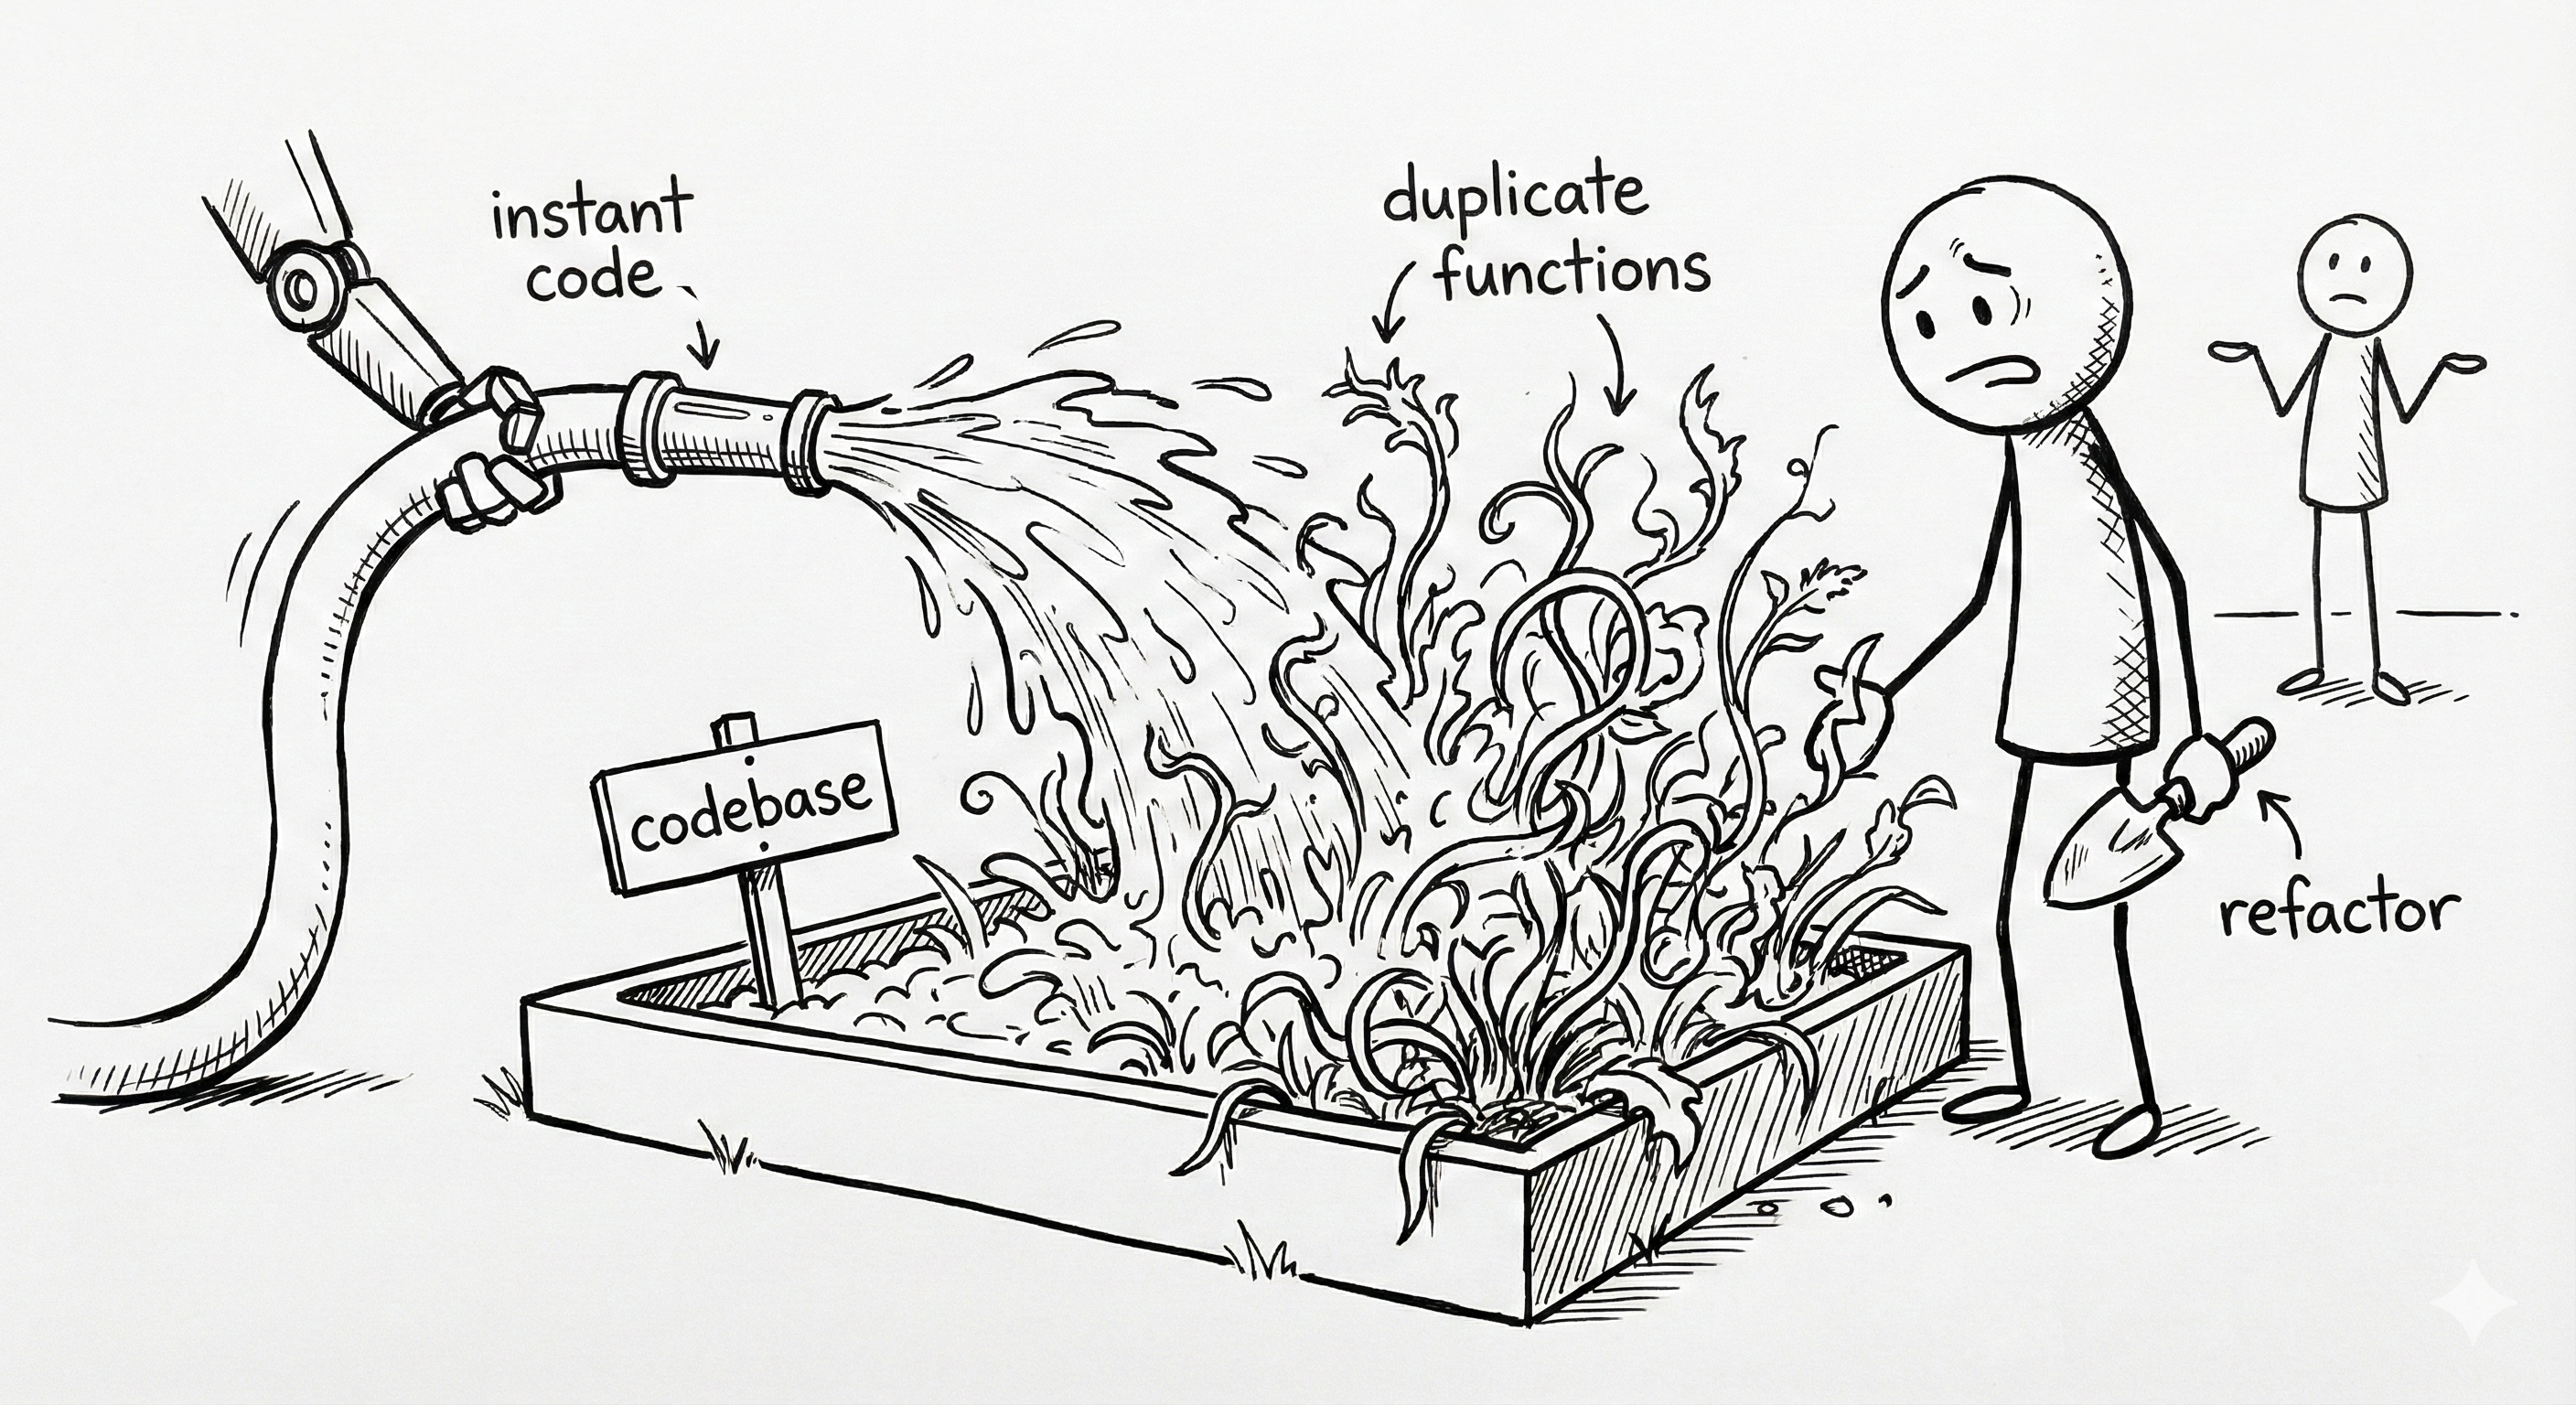
<p><a href="/assets/images/2026-01-10-invisible-tax-ai-code/instant-code.png" class="image-popup">
  <img src="/assets/images/2026-01-10-invisible-tax-ai-code/instant-code.png" alt="An AI 'instant code' hose flooding a tidy codebase garden with fast-growing duplicate weeds, while a developer tries to refactor with a small spade." style="width: 50%; float: right; margin-left: 20px; margin-bottom: 10px;  margin-top: 12px;" />
</a></p>

<p>GitClear’s AI code quality research looks at real codebase change patterns rather than anecdotes. Their headline signal is a shift in how code changes happen.</p>

<p>They found that “moved” code is down (often a proxy for refactoring), while copy/paste changes are up (duplicate logic - no respect for the rule of three).</p>

<p>The problem, is the path of least resistance. It’s easier to ask a model to “add a function that does X” (append-only) than to ask it to “refactor the existing class to support X generically” (edit-in-place). Without strict guidance, the default outcome is a codebase that grows faster than it improves.</p>

<p><strong>Why epistemic debt makes this worse:</strong> If you don’t deeply understand the change, you won’t recognize when you’re duplicating existing logic. The AI draft looks reasonable, tests pass, so you merge it - never realizing you just created the third variation of the same pattern.</p>

<p><strong>What this costs in practice:</strong> duplicated logic, inconsistent behaviour, and more code to maintain. This is something I <em>have</em> seen firsthand.</p>

<h3 id="2-you-cant-catch-the-security-flaw">2. You can’t catch the security flaw</h3>

<p><a href="/assets/images/2026-01-10-invisible-tax-ai-code/security.png" class="image-popup">
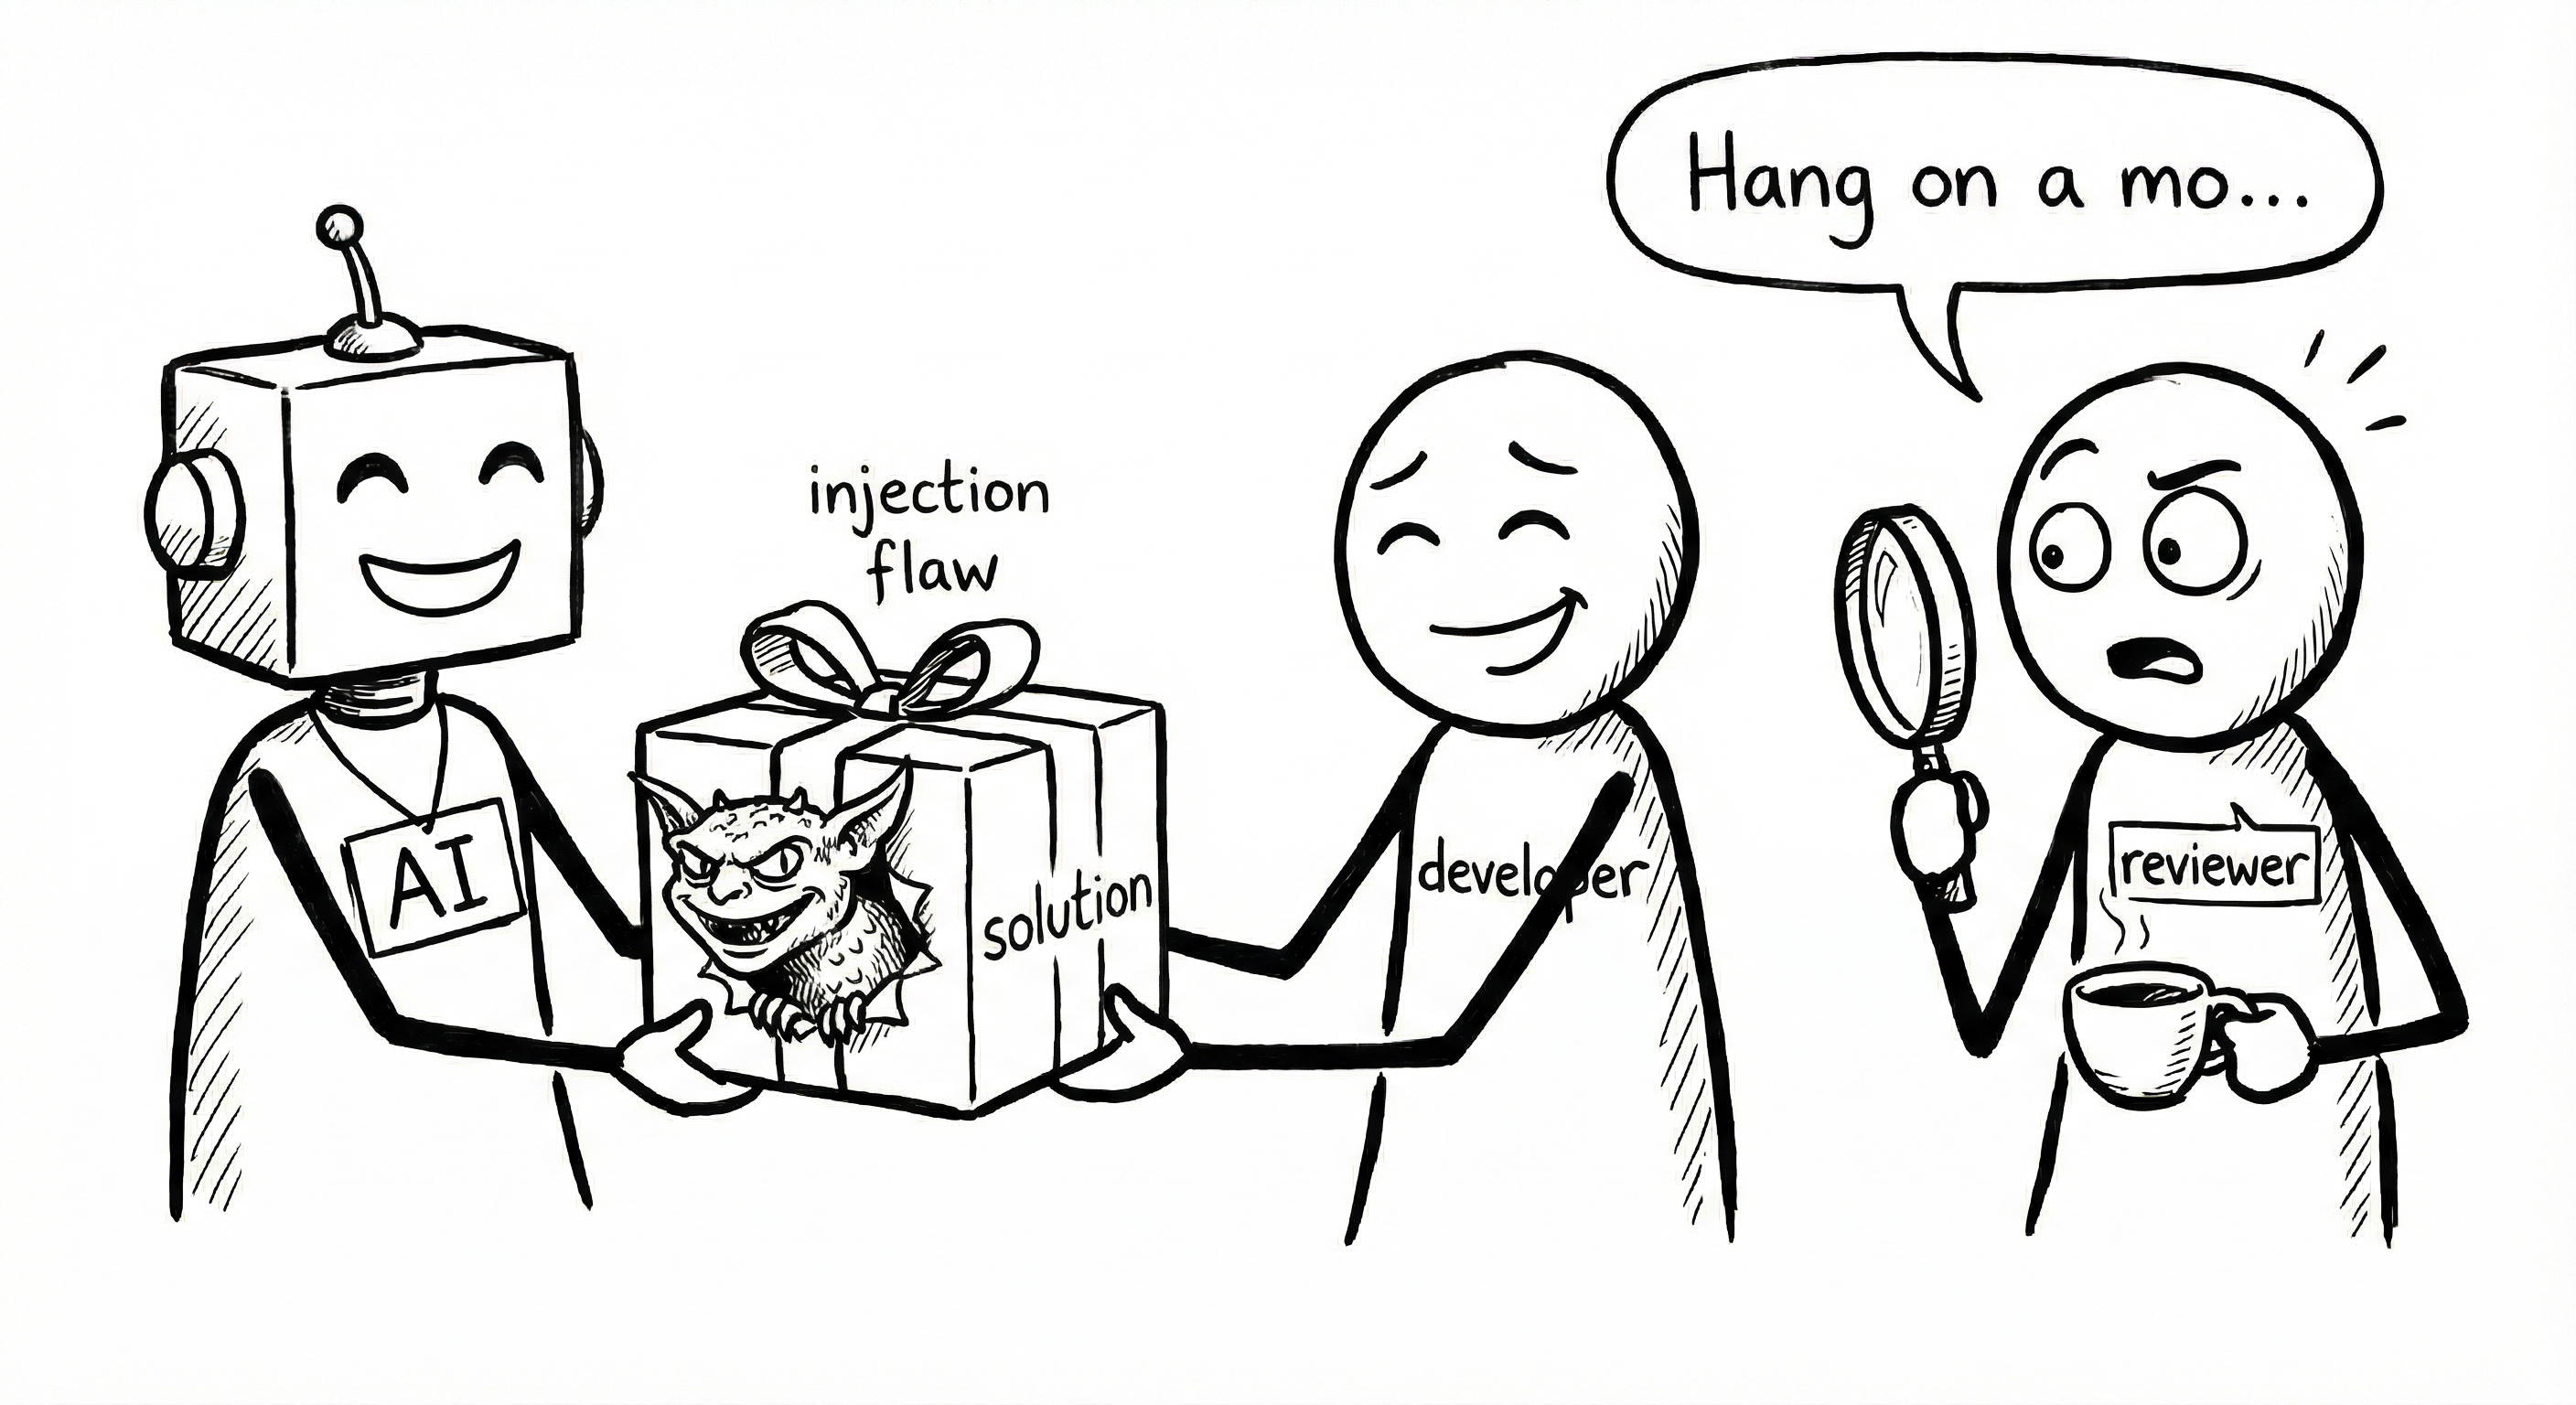
  <img src="/assets/images/2026-01-10-invisible-tax-ai-code/security.png" alt="A cheerful AI intern hands over a neat 'solution' box while a small 'injection flaw' gremlin hides inside. A reviewer looks alarmed." style="width: 50%; float: left; margin-right: 20px; margin-bottom: 10px; margin-top: 12px;" />
</a></p>

<p>Models <em>are</em> getting better at security. But the research highlights a human problem, not a machine problem: <strong>overconfidence</strong>.</p>

<p>Because the code arrives formatted, commented, and syntactically perfect, our brains lower their guard. We assume competence in syntax equals competence in logic.</p>

<p><strong>Why epistemic debt makes this worse:</strong> It is not always a blatant injection flaw. It is often a subtle logic assumption that looks reasonable in review, passes tests, then fails in production because the real world violates an unstated precondition. If you don’t understand the implementation deeply, you won’t spot the hidden assumption.</p>

<p><strong>What this costs in practice:</strong> Security incidents and production failures that could have been caught in review - if the author or reviewer had built a proper mental model of how the code actually works.</p>

<h3 id="3-you-cant-diagnose-stability-issues">3. You can’t diagnose stability issues</h3>

<p>DORA’s reporting captures something many teams are feeling: AI can lift individual throughput, while trust, coordination, and stability become the limiting factors.</p>

<p>My shorthand for this is the <strong>vacuum hypothesis</strong>:</p>

<blockquote>
  <p>Time saved on authoring is vacuumed up by review, debugging, coordination, and operational work.</p>
</blockquote>

<p><strong>Why epistemic debt makes this worse:</strong> When something breaks in production, the person who wrote the code can’t explain how it was supposed to work. The team has to reverse-engineer intent from the diff, logs, and history - paying twice to understand what should have been understood before merge.</p>

<p>That is not an argument against AI. It is an argument against treating it as free speed.</p>

<h2 id="opting-out-is-not-realistic">Opting out is not realistic</h2>

<p>Even if you accept every risk above, I don’t believe that a full opt-out is viable. Some work genuinely becomes cheaper, especially scaffolding and first drafts - and if you refuse that leverage entirely, someone else will ship faster.</p>

<p>This is the uncomfortable part: if AI gives even a 20% advantage in certain loops, the teams that take it will deliver features faster, and markets will reward them. The market does not care if your code was artisanally hand-crafted, if you ship six months late.</p>

<p>So the question is not “AI or no AI”. It is “what operating model prevents AI from turning speed into debt”.</p>

<h2 id="where-epistemic-debt-shows-up-in-teams">Where epistemic debt shows up in teams</h2>

<ul>
  <li><strong>LGTM in good faith:</strong> the reviewer wants to review properly, but the author cannot explain intent, assumptions, or failure modes. Review degrades into “tests pass and it looks tidy”.</li>
  <li><strong>Silent contracts:</strong> the implementation bakes in an unstated assumption (ordering, nullability, idempotency, tenancy, time zones). The tests mirror the assumption, so nothing fails until production violates it.</li>
  <li><strong>Dependency drift timebomb:</strong> AI pulls in a library or pattern that is slightly off your ecosystem (licensing posture, security posture, operational footprint). Months later you hit a vulnerability advisory or an upgrade break, and nobody can answer why it is there.</li>
</ul>

<p>One caveat: decent models do now produce good comments and a neat explanation of what they did. That helps. But comments are not comprehension. The debt is paid down only when a human can explain the change, including what it assumes and how it can fail.</p>

<h3 id="the-review-bottleneck-10-seconds-to-generate-10-minutes-to-review">The review bottleneck: 10 seconds to generate, 10 minutes to review</h3>

<p><a href="/assets/images/2026-01-10-invisible-tax-ai-code/review.png" class="image-popup">
  <img src="/assets/images/2026-01-10-invisible-tax-ai-code/review.png" alt="A conveyor belt labelled 'AI draft' producing code-change boxes faster than one reviewer can inspect with a magnifying glass." style="width: 40%; float: right; margin-left: 20px; margin-bottom: 10px;" />
</a></p>

<p>AI changes the shape of the pipeline:</p>

<ul>
  <li>Drafting got a lot cheaper.</li>
  <li>Review, validation, and operational confidence did not.</li>
</ul>

<p>This is where “LGTM syndrome” comes from. Reviewers are asked to absorb more change than attention allows, so they start pattern-matching for obvious issues and miss deeper problems: intent mismatches, edge cases, and system impact.</p>

<h2 id="the-solution-is-to-embrace-but-validate">The solution is to embrace, but validate</h2>

<p>This is the pivot: the total cost of AI is only high if you treat it as magic.</p>

<p>The analogy I keep coming back to is aviation. Modern systems can automate an enormous amount of the routine work, and they do it with superhuman consistency.</p>

<p>But the operating model still assumes a pilot in control of aircraft: someone who understands what the system is trying to do, monitors for when reality diverges from the model, and takes over when it matters. The risk is not that the automation is stupid - it’s that it is <em>good enough</em> to lull you into not noticing when you’re no longer fully in control.</p>

<p>Capability is not the same thing as responsibility.</p>

<p>Treat AI like a junior engineer: fast, useful, sometimes brilliant, often overconfident, and in need of constraints and checks.</p>

<h3 id="shift-the-mindset-from-write-code-to-own-intent">Shift the mindset from “write code” to “own intent”</h3>

<p>If you use AI as autocomplete, you get faster typing.</p>

<p>If you use AI as an agent, you can move faster without losing intent, but <em>only</em> if you add guardrails.</p>

<p>I wrote about this in <a href="/autocomplete-was-never-the-point/">Autocomplete Was Never the Point</a>: I believe the true the leverage is delegation, not predictive completion.</p>

<h2 id="the-bottom-line">The bottom line</h2>

<p>The illusion of competence is the real risk. AI produces code that <em>looks</em> professional, tests that pass, diffs that seem reasonable - but without the understanding you need to maintain it.</p>

<p>If you treat AI as free speed, you will pay interest later in churn, security incidents, slower reviews, and <strong>epistemic debt</strong>: working code that nobody on the team can fully explain.</p>

<p>If you treat AI as a fast intern, and invest in solid <strong>specs</strong>, <strong>tests</strong>, and <strong>validation gates</strong>, you can keep the speed without bankrupting the codebase.</p>

<p>Use AI. Get good at it. But keep your hands on the wheel. If you can’t explain the change in plain language, it isn’t speed - it’s epistemic debt, and the bill will arrive when you least expect it.</p>

<h2 id="sources">Sources</h2>

<ul>
  <li><a href="https://www.gitclear.com/coding_on_copilot">GitClear: Coding on Copilot (AI code quality research)</a> - change-pattern analysis (code movement vs copy/paste signals)</li>
  <li><a href="https://cloud.google.com/resources/dora-report-2024">DORA: Accelerate State of DevOps Report 2024</a> - delivery performance framing, with notes on generative AI and outcomes</li>
  <li><a href="https://medium.com/ai-advances/your-ai-coding-assistant-is-quietly-creating-a-new-kind-of-technical-debt">Your AI Coding Assistant Is Quietly Creating a New Kind of Technical Debt</a> - Stanislav Komarovsky, Medium (2025)</li>
  <li><a href="https://vixra.org/">The Illusion of Competence: Defining ‘Epistemic Debt’ in the Era of LLM-Assisted Software Engineering</a> - Ludovic Ngabang, viXra (2026)</li>
  <li><a href="https://www.researchgate.net/">Epistemic Debt: A Concept and Measure of Technical Ignorance</a> - Ionescu et al. (2019) (The original academic definition in manufacturing)</li>
  <li><a href="https://arxiv.org/abs/2211.03622">Do Users Write More Insecure Code with AI Assistants?</a> - Perry et al., arXiv (Stanford/Cornell), 2022</li>
  <li><a href="https://arxiv.org/pdf/2311.11177">Assessing the Security of GitHub Copilot’s Generated Code</a> - Majdinasab et al., arXiv, 2023 (replicating and extending Copilot security analyses)</li>
  <li><a href="https://dora.dev/research/ai-assisted-software-development/">DORA: State of AI-assisted Software Development (2025)</a> - DORA research on how AI interacts with software delivery outcomes</li>
</ul>]]></content><author><name>Ben Hall</name></author><category term="AI" /><category term="Development" /><category term="ai" /><category term="engineering" /><category term="code-review" /><category term="security" /><category term="technical-debt" /><category term="productivity" /><summary type="html"><![CDATA[AI makes drafting cheap. The bill arrives later as review load, churn, security risk, and epistemic debt. The teams that win treat AI like an intern: fast, useful, and never unsupervised.]]></summary></entry><entry><title type="html">Autocomplete is not the point: Agentic AI Coding</title><link href="https://failingfast.io/autocomplete-was-never-the-point/" rel="alternate" type="text/html" title="Autocomplete is not the point: Agentic AI Coding" /><published>2026-01-03T00:00:00+00:00</published><updated>2026-01-03T00:00:00+00:00</updated><id>https://failingfast.io/autocomplete-was-never-the-point</id><content type="html" xml:base="https://failingfast.io/autocomplete-was-never-the-point/"><![CDATA[<p class="notice--primary"><strong>TL;DR:</strong> AI can produce a lot, quickly. The job is keeping it coherent: what are we changing, why, what breaks, how do we know, and how do we roll it out. Delegation is the win; responsibility doesn’t go away.</p>

<p>I’m talking about tools like ChatGPT and GitHub Copilot used as delegated, parallel workers, not just autocomplete.</p>

<h2 id="autocomplete---intellisense-on-crack">Autocomplete - “Intellisense on crack”</h2>

<p><a href="/assets/images/2026-01-03-autocomplete-was-never-the-point/autocomplete.png" class="image-popup">
  <img src="/assets/images/2026-01-03-autocomplete-was-never-the-point/autocomplete.png" alt="Cartoon of a developer typing at a computer while an AI character leans out of the screen and types ahead, saying 'I finished it.' The developer looks surprised as the code continues beyond where they were typing." style="width: 34%; float: left; margin-right: 20px; margin-top: 12px; margin-bottom: 10px;" />
</a></p>

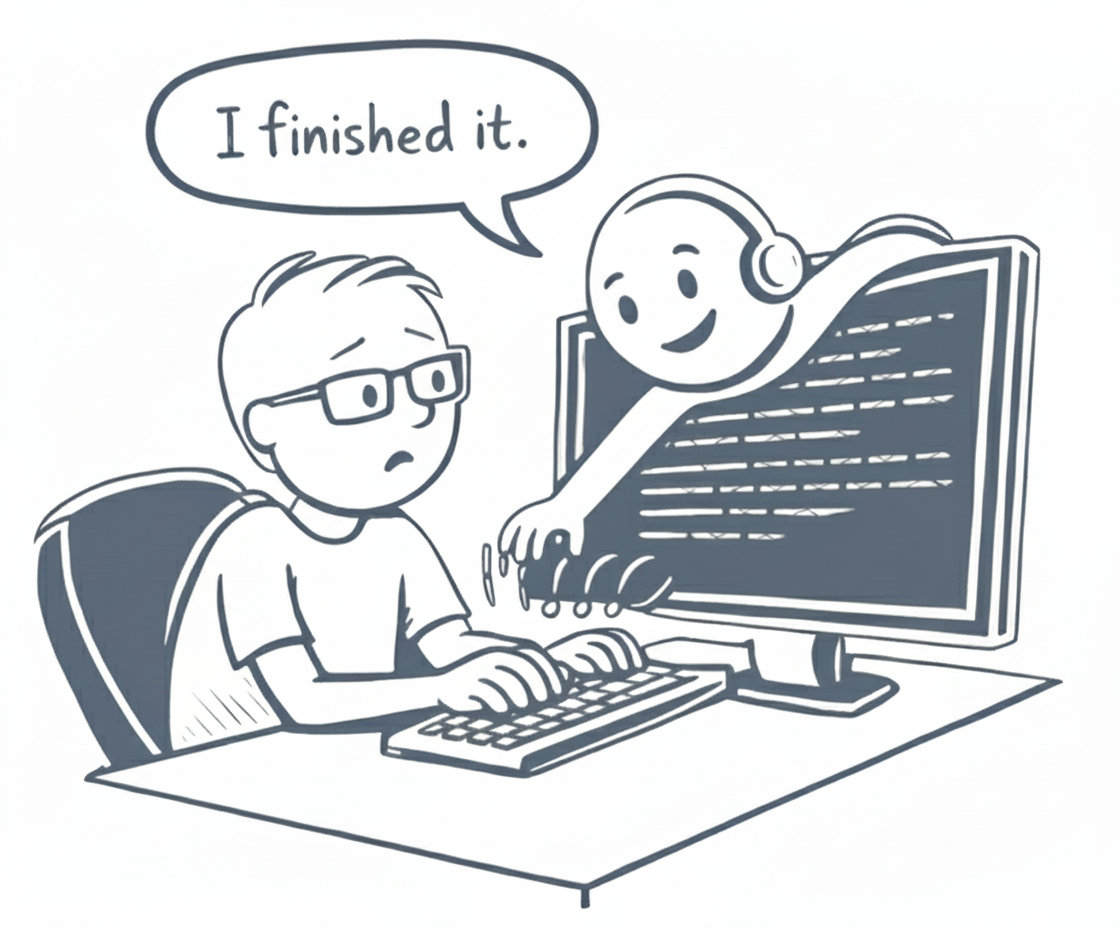
<p>The version of AI I’m <em>not</em> excited about is predictive autocomplete that confidently guesses whole functions, control flow, or behaviour from a few lines of context.</p>

<p>When I’m choosing to do the coding myself, I want to think: shape the solution deliberately, reason about constraints, edge cases, and failure modes. Having an LLM jump ahead and guess my intent often interrupts that process more than it helps.</p>

<p>I <em>am</em> a fan of mechanical shortcuts. What I don’t want is intent guessed for me.</p>

<p>It was initially how AI-assisted coding was framed - less boilerplate and smarter in-editor suggestions. The problem is that this framing has lingered, and it obscures where the leverage actually is now.</p>

<h2 id="code-review-as-an-example">Code review as an example</h2>

<p>I’m seeing the same sales pitch around code review: treat review as a throughput problem, then sell AI as the fix.</p>

<p>That’s risky, because review is one of the places we <em>most</em> need human attention. It’s where we check intent and system impact: what are we changing, why, what could break, and what does this do to everything around it.</p>

<p>If a draft was generated in seconds, review can accidentally become the first time a human brain really processes the change. That is a massive shift in responsibility, and it’s not a shift you want by default.</p>

<p>I do use AI to assist code reviews, but more for broad coverage, like automated tests or static analysis. It catches obvious issues and asks awkward questions early, so I can spend time on the high-value part. Even here, model choice matters: fast models for surface-level checks; stronger reasoning models when I want it to challenge risk and trade-offs. (<a href="https://failingfast.io/ai-coding-guide/">See my quick picks</a>.)</p>

<p class="pull-quote">AI-in-review has to be intentional.</p>

<p>I’ll pull the diff down, ask targeted questions, and treat it as one of the steps in my review. Always-on analysis in a PR risks becoming ambient noise. I want AI to sharpen attention, not dilute it.</p>

<h2 id="the-mode-that-actually-changed-how-i-work">The mode that actually changed how I work</h2>

<p><a href="/assets/images/2026-01-03-autocomplete-was-never-the-point/ai-change.png" class="image-popup">
  <img src="/assets/images/2026-01-03-autocomplete-was-never-the-point/ai-change.png" alt="Two-panel cartoon contrasting AI typing ahead of a developer with a developer coordinating multiple AI tasks across several screens." style="width: 56%; float: right; margin-left: 20px; margin-top: 12px; margin-bottom: 8px;" />
</a></p>

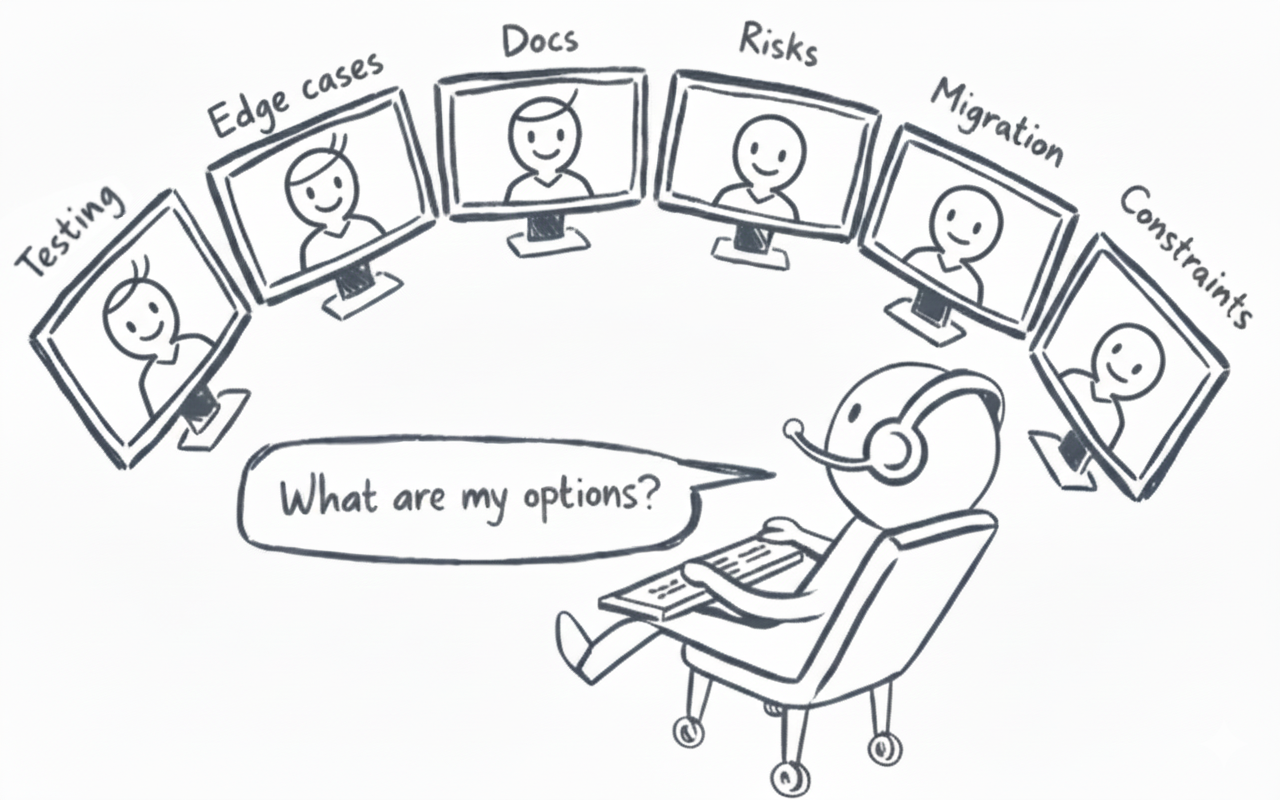
<p>For the moment, we’ve settled into a different shape of collaboration with AI, and it is not autocomplete. It is <strong>agentic chat</strong>: chat, plus delegated tasks that can read code, suggest edits across files, run checks, and iterate.</p>

<p>Instead, <strong>delegation</strong>: working the way I already work with a team, just faster and more parallel. Delegation also requires more discipline than doing it yourself.</p>

<p>This feels natural if your day already involves coordinating work, managing risk, and holding the system in your head, rather than staying deep in one implementation thread.</p>

<p>On non-trivial work there are always multiple threads: explore an approach, test assumptions, read docs, check edge cases, and do setup/testing. Agentic AI lets me run those threads in parallel. I’ll put one agent on a migration strategy, another on a data model, another on a library I don’t fully trust yet. I question the answers, push back, redirect, discard a lot, and I’m still the one steering: scope, priorities, and what “done” means.</p>

<p class="pull-quote">That doesn’t feel like automation. It feels like leadership.</p>

<h2 id="why-this-feels-familiar-to-experienced-engineers">Why this feels familiar to experienced engineers</h2>

<p>Agentic AI clicked for me quickly because it doesn’t require a new way of thinking about engineering.</p>

<p>Many of the practices we rely on now, exist to reduce risk, not maximise speed: pairing, design review, parallelising work, challenging assumptions. Agentic AI fits into this perfectly.</p>

<p class="pull-quote">Double down on what good teams already do</p>

<p>This is why the joking around “AI-assisted juniors” misses the point. When code is cheap, unclear intent is expensive, and you feel it faster. The answer isn’t to reject the tool. It’s to double down on what good teams already do: strong review, explicit assumptions, and real ownership.</p>

<p>Agentic AI makes it much faster to try ideas, but it does not remove the need to do the work engineers have always done: understanding requirements, thinking through design, checking assumptions, and considering system impact.</p>

<p>Experience compounds here. The hard part was never typing code. It was knowing what mattered, what could go wrong, and where to be careful.</p>

<h2 id="where-things-actually-go-wrong">Where things actually go wrong</h2>

<p>What I’m seeing in on the ground now is not about seniority. It is about <strong>mode selection</strong>.</p>

<ul>
  <li><strong>Overuse without discipline:</strong> the AI does good local work, but the developer stops leading the system. Scope, constraints, and checks aren’t made explicit.</li>
  <li><strong>Underuse out of principle:</strong> treating failure as proof it has no place in serious work. We wouldn’t judge a human collaborator this way.</li>
  <li><strong>Confusion about responsibility:</strong> oscillating between over-trust and total dismissal, because no one has a clear model for what humans must still own.</li>
</ul>

<h2 id="the-elephant-in-the-room---our-future-as-devs">The elephant in the room - our future as devs</h2>

<p><a href="/assets/images/2026-01-03-autocomplete-was-never-the-point/elephant.png" class="image-popup">
  <img src="/assets/images/2026-01-03-autocomplete-was-never-the-point/elephant.png" alt="Drawing of an elephant developer at a desk with a chaotic mess of abstract shapes funneling out from the computer after asking AI to create an app." style="width: 50%; float: left; margin-right: 20px; margin-top: 12px; margin-bottom: 8px;" />
</a></p>

<p>In the very long term, if the rate of improvement continues, it’s reasonable to ask whether we still need as many developers in the trenches 😢</p>

<p>But my bigger concern is <em>messy middle phase</em>: the months/years (maybe longer) where the tools are powerful enough to create a convincing demo, but not reliable enough to run a business-critical system without human engineering behind it.</p>

<p>This is also where the incentives get weird. If AI makes it look like software is now “just prompts”, some organisations will try to route feature delivery around engineering: PMs, analysts, or vendor teams driving changes directly.</p>

<p>We’ve seen this movie before in waves of “we don’t need developers”: low-code/no-code platforms, heavily outsourced feature teams, third-party “service accelerators”. The pitch is always the same: the business can move faster without waiting for engineers.</p>

<p>The outcome is often the same too:</p>

<ul>
  <li>It works for simple cases, then hits hard limits (it can’t do X or Y).</li>
  <li>The platform/support burden is underestimated (observability, security, upgrades, incident response, data migrations). Or overlooked completely and it just gets handed over to the Platform team with no warning!</li>
  <li>The best developers leave or refuse to touch it because it feels like downskilling.</li>
  <li>The remaining work becomes mostly glue code and escape hatches, until you end up with a Franken-system: part platform, part bespoke, hard to change, and hard to reason about.</li>
</ul>

<p>That’s why I’m pushing the “delegation” framing for now. If you treat AI like a shortcut around engineering, you get fragile systems. If you treat it as a force-multiplier <em>inside</em> engineering, you can get real speed without losing ownership of intent.</p>

<h2 id="where-the-real-cost-shows-up">Where the real cost shows up</h2>

<p class="notice--primary"><strong>
  <kbd>Idea</kbd> → <kbd>What/Why (spec)</kbd> → <kbd>Draft (AI or human)</kbd> → <kbd>Validate (tests/checks)</kbd> → <kbd>Review (PR)</kbd> → <kbd>Merge</kbd>
</strong></p>

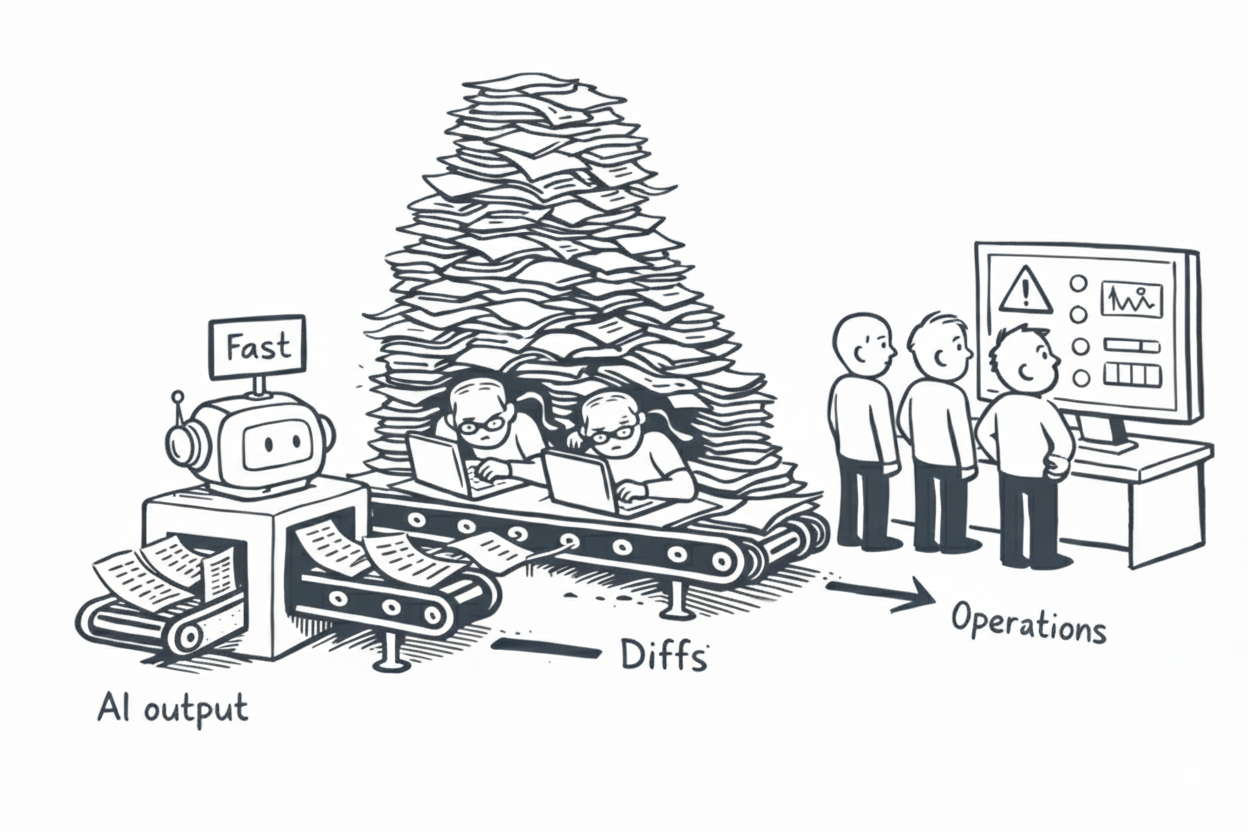
<p><a href="/assets/images/2026-01-03-autocomplete-was-never-the-point/downstreamcost.png" class="image-popup">
  <img src="/assets/images/2026-01-03-autocomplete-was-never-the-point/downstreamcost.png" alt="Cartoon of a conveyor belt moving from AI output to reviewers buried in large diffs, then to an operations team watching warning alerts." style="width: 42%; float: right; margin-left: 20px; margin-top: 11px; margin-bottom: 16px;" />
</a></p>

<p>The engineering pipeline doesn’t change. AI just compresses the <kbd>Draft</kbd> step, which increases pressure on <kbd>Spec</kbd> and <kbd>Validation</kbd>.</p>

<p>AI makes exploration cheap and parallel. If you don’t do the normal engineering work (what’s changing, why, what might break, how you’ll know, and how you’ll roll it out), the cost shows up later.</p>

<p>There’s another cost that’s easy to miss: the developer may ship changes without coming away with much understanding of what they just built. That knowledge doesn’t transfer automatically just because the code exists.</p>

<p>This is the shape of what’s now being called <strong>epistemic debt</strong>: working code with missing understanding, where the bill arrives later when you need to change it, debug it, or defend it in review. I wrote more about it here: <a href="/ai-epistemic-debt/">Epistemic Debt: the hidden cost of AI speed</a>.</p>

<p><strong>Example 1:</strong> One common failure mode is brittle tests: AI can generate “good looking” UI tests from a snapshot of what it sees today, baking in incidental details. They pass once, then become a maintenance trap.</p>

<p><strong>Example 2:</strong> Subtle logic drift: the developer steps back, the model decides the shape, and the code can look tidy, pass the wrong tests, and still be wrong.</p>

<p>And yes, it also shows up as larger diffs, slower reviews, fuzzier intent, and a gradual erosion of trust. That is where guardrails become necessary.</p>

<h2 id="the-guardrails-i-rely-on">The guardrails I rely on</h2>

<p>These aren’t rules. They’re the defaults I <em>try</em> to fall back to when the pace goes up and it becomes easy to lose intent. Think of them as team-friendly expectations: the kind of thing you can say out loud in review without it sounding personal.</p>

<p><strong>No explanation, no merge.</strong> If the author can’t explain what changed, why it changed, what it assumes, and how it can fail, it shouldn’t ship yet. That’s the simplest way I know to avoid epistemic debt.</p>

<p><strong>Write the intent down before you “improve” the code.</strong> For any non-trivial change, we want a tiny written spec somewhere (often just the PR description):</p>

<ul>
  <li>What behaviour is changing?</li>
  <li>What is explicitly <em>not</em> changing?</li>
  <li>What assumptions does this rely on?</li>
  <li>How did we validate it (tests, checks, manual verification)?</li>
</ul>

<p>If the model drafts a neat explanation, it’s worth rewriting it in your own words. If you can’t, that’s a signal the change isn’t understood yet.</p>

<p><strong>Keep diffs reviewable.</strong> Large diffs collapse multiple decisions into one review moment. If something small turns into something big, it’s usually a sign to split it: isolate refactors from behaviour changes, and isolate scaffolding from logic.</p>

<p><strong>Treat tests as product code.</strong> This is where I’ve been bitten. AI generates plausible UI tests from “what the page looks like today”, and they pass once before turning brittle. Aim for tests that assert intent (what must be true), not incidental structure.</p>

<p><strong>If it feels too easy, pause.</strong> Switching models, changing behaviour (not just refactoring), touching multiple concerns, or widening scope should trigger a deliberate check-in. If everything feels effortless, it’s worth assuming something important is being skipped and slowing down on purpose.</p>

<p>I’m also thinking about lightweight “guardrails for agents” kept close to the code (a short repo rules file). If it works, it will be because it’s short, specific, and enforced by review and tooling.</p>

<h2 id="how-i-work-right-now">How I work right now</h2>

<p>Sometimes I code by hand because I want to think. Sometimes I delegate aggressively because I want to think and create in parallel.</p>

<p>Doing this well in a team needs a bit of humour. AI will occasionally do something brilliant, and occasionally do something confidently bizarre. I would rather we can say “that was the model” without embarrassment than pretend none of this is happening. The goal is not secrecy, it is shared habits.</p>

<p class="pull-quote">Make AI usage visible, or you can’t manage the risk.</p>

<p>The worst outcome is when people feel they have to hide it. If reviewers don’t know where AI was used heavily, they can’t dial up the right kind of scrutiny (intent, assumptions, tests, and edge cases). Keeping it in the open also lets teams get better together: what prompts worked, what failed, and what guardrails actually helped.</p>

<p>Working with agentic AI looks similar to how I work as a lead developer: I hand off scoped work, review what comes back, and step in to keep the delivery connected, so intent does not get lost as things move faster.</p>

<p>I am definitely not advocating any plan to replace engineers. I <em>am</em> trying to make sure their attention is spent where it pays off most.</p>

<h2 id="what-im-watching-next-the-systems-thinking-gap">What I’m watching next: The systems thinking gap</h2>

<p>This model works best for people who already know how to keep a system coherent: what matters, what can break, what to validate, and what to roll back. My biggest question is how a new generation learns that judgement when the act of drafting has become near-instant.</p>

<p>You always had to care what happens after shipping. The difference is you now hit that part much sooner, because code is cheap.</p>

<p>Systems thinking is the habit of asking “what else does this touch?”, other services, data, users, operational load, and failure modes.</p>

<p>Part of that is learning the end-to-end lifecycle of a change. For example:
<strong>Requirements → Design → Tests → Rollout → Ops</strong></p>

<p>Agentic AI doesn’t remove responsibility; it concentrates it.</p>

<p class="pull-quote">Delegation is a senior skill - start teaching it deliberately.</p>

<p>The teams that win won’t just be the ones with the best tools. They’ll be the ones that realise <strong>delegation is a senior skill</strong> and start teaching it deliberately.</p>]]></content><author><name>Ben Hall</name></author><category term="AI" /><category term="Developer Tools" /><category term="ai" /><category term="coding" /><category term="leadership" /><category term="agentic" /><category term="code-review" /><category term="copilot" /><category term="cursor" /><category term="windsurf" /><category term="chatgpt" /><category term="llm" /><summary type="html"><![CDATA[Autocomplete isn’t the real shift in AI-assisted coding. The leverage comes from agentic work, disciplined delegation, and keeping human responsibility where it pays off.]]></summary></entry><entry><title type="html">Local AI Models for Coding: Is It Realistic in 2026?</title><link href="https://failingfast.io/local-coding-ai-models/" rel="alternate" type="text/html" title="Local AI Models for Coding: Is It Realistic in 2026?" /><published>2025-12-30T00:00:00+00:00</published><updated>2025-12-30T00:00:00+00:00</updated><id>https://failingfast.io/local-ai-models-for-coding</id><content type="html" xml:base="https://failingfast.io/local-coding-ai-models/"><![CDATA[<p>Running AI models locally for coding is increasingly viable - but is it realistic for <em>your</em> setup? Let’s cut through the hype and look at concrete numbers.</p>

<h2 id="why-would-you-go-local">Why would you go local?</h2>

<ul>
  <li><strong>Cost</strong> - No API fees, no usage limits</li>
  <li><strong>Latency</strong> - No network round-trip (faster autocomplete)</li>
  <li><strong>Privacy</strong> - Code never leaves your machine</li>
  <li><strong>Offline</strong> - Works on planes, in secure environments</li>
</ul>

<p>The trade-off: you need decent hardware, and local models still lag behind the best cloud models.</p>

<h2 id="the-hardware-reality">The hardware reality</h2>

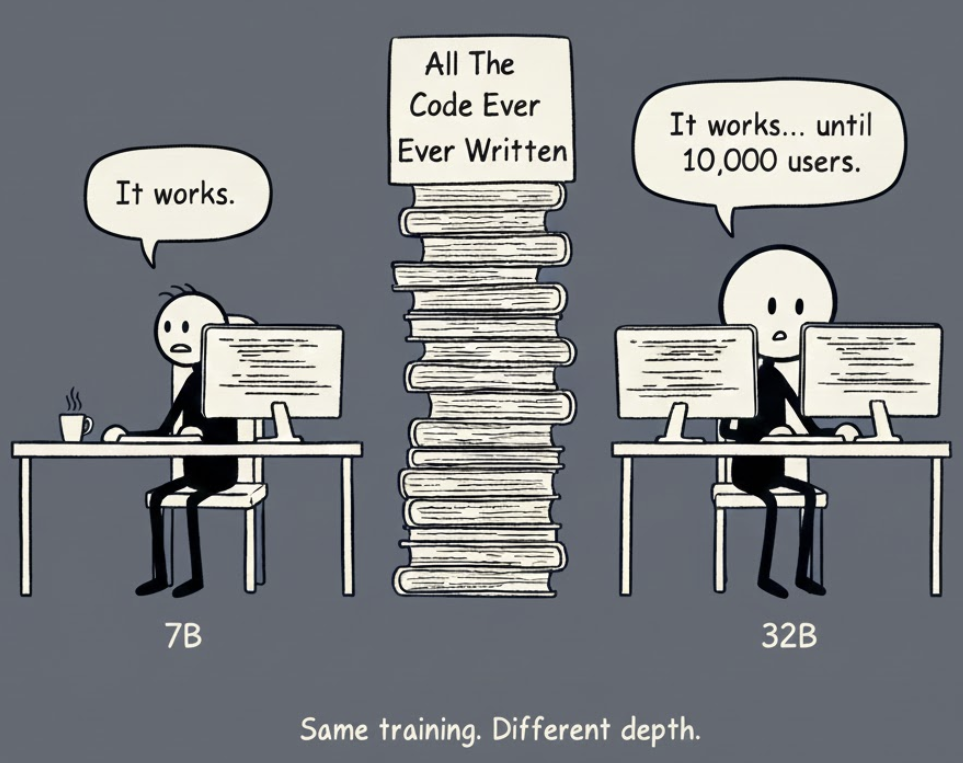
<p><a href="/assets/images/2025-01-01-local-ai-models-for-coding/7b-vs-32b.png" class="image-popup">
  <img src="/assets/images/2025-01-01-local-ai-models-for-coding/7b-vs-32b.png" alt="Two stickmen at desks looking at code, with a tall stack of books labeled 'All The Code Ever Written' between them. The 7B model says 'It works.' The 32B model says 'It works... until 10,000 users.' Caption: Same training. Different depth." style="width: 40%; float: right; margin-left: 20px; margin-bottom: 20px;" />
</a></p>

<p>Running LLMs locally requires GPU VRAM. The “B” in model names (7B, 14B, 32B) means <em>billions of parameters</em> (<a href="/ai-dev-faq/#parameters">what’s this?</a>) - the learnable weights that define the model. More parameters generally means smarter, but also more VRAM needed.</p>

<p>A 7B and 32B model are typically trained on the <em>same</em> code/data - the difference is brain capacity, not knowledge.</p>

<p>7B (seven billion) sounds massive, but for context: GPT-4 is estimated at 1.7 <em>trillion</em> parameters, and even that makes mistakes. A 7B model can absolutely write correct code, but it holds fewer patterns (<a href="/ai-dev-faq/#patterns">what’s this?</a>) in its head simultaneously. On straightforward tasks (“write a function that sorts this list”), 7B and 32B perform similarly. The gap shows up when juggling multiple concerns at once: “refactor this authentication flow while maintaining backward compatibility with the legacy API and handling the edge case where tokens expire mid-request.”</p>

<h4 id="vram-requirements-by-gpu">VRAM requirements by GPU</h4>

<table>
  <thead>
    <tr>
      <th>Your GPU</th>
      <th>VRAM</th>
      <th>What you can run</th>
      <th>Quality level</th>
    </tr>
  </thead>
  <tbody>
    <tr>
      <td>RTX 3060/4060</td>
      <td>8GB</td>
      <td>7B models</td>
      <td>Good for autocomplete</td>
    </tr>
    <tr>
      <td>RTX 3080/4070</td>
      <td>12GB</td>
      <td>7B (comfortable)</td>
      <td>Autocomplete + basic chat</td>
    </tr>
    <tr>
      <td>RTX 3090/4080</td>
      <td>16GB</td>
      <td>14B models</td>
      <td>Decent all-around</td>
    </tr>
    <tr>
      <td>RTX 4090</td>
      <td>24GB</td>
      <td>32B models</td>
      <td>Approaches cloud quality</td>
    </tr>
    <tr>
      <td>Apple M2/M3 Max</td>
      <td>32GB+</td>
      <td>32-70B quantized</td>
      <td>Very capable</td>
    </tr>
    <tr>
      <td>Apple M2/M3 Ultra</td>
      <td>64GB+</td>
      <td>70B+ models</td>
      <td>Near cloud quality</td>
    </tr>
  </tbody>
</table>

<p><strong>A note on “quantized” models:</strong> (<a href="/ai-dev-faq/#quantization">what’s this?</a>) When you download a local model, you’ll see options like “Q4” or “Q5”. These are compressed versions that use less VRAM (roughly half) with only minor quality loss. The VRAM numbers in this article assume Q4 - if you see “FP16” or “full precision”, expect to need roughly double the VRAM. Just stick with Q4/Q5 and you’ll be fine.</p>

<h2 id="local-coding-models-as-of-december-2025">Local coding models as of December 2025</h2>

<h3 id="qwen-25-coder---the-current-champion">Qwen 2.5 Coder - the current champion</h3>

<p>Alibaba’s <strong>Qwen 2.5 Coder</strong> series currently dominates local coding benchmarks for realistic hardware. It is a “standard” instruct model: you ask for code, and it gives you code immediately.</p>

<table>
  <thead>
    <tr>
      <th>Model</th>
      <th>Size (Params)</th>
      <th>VRAM (Q4)</th>
      <th>Aider score</th>
      <th>Best For</th>
    </tr>
  </thead>
  <tbody>
    <tr>
      <td><strong>Qwen 2.5 Coder 32B</strong></td>
      <td>32B</td>
      <td>~20GB</td>
      <td><strong>72.9%</strong></td>
      <td>Daily driver matches GPT-4o quality.</td>
    </tr>
    <tr>
      <td><strong>Qwen 2.5 Coder 14B</strong></td>
      <td>14B</td>
      <td>~9GB</td>
      <td>69.2%</td>
      <td>Great for 16GB GPUs.</td>
    </tr>
    <tr>
      <td><strong>Qwen 2.5 Coder 7B</strong></td>
      <td>7B</td>
      <td>~5GB</td>
      <td>57.9%</td>
      <td>Good for autocomplete/speed.</td>
    </tr>
    <tr>
      <td><strong>Qwen 2.5 Coder 3B</strong></td>
      <td>3B</td>
      <td>~2GB</td>
      <td>39.1%</td>
      <td>Low-end devices. Lightweight but limited.</td>
    </tr>
  </tbody>
</table>

<p>For context: Claude 3.5 Sonnet scores 84.2%, while GPT-4o scores 72.9% on the same <a href="https://aider.chat/docs/leaderboards/">Aider benchmark</a>.</p>

<h3 id="the-reasoning-trap-r1-vs-qwen">The “Reasoning” Trap: R1 vs. Qwen</h3>

<p>You will see DeepSeek R1 mentioned loads. Note that while R1 Distill 32B is the same size as Qwen 32B, it is a <strong>reasoning</strong> model (like OpenAI o1).</p>

<ul>
  <li><strong>Qwen 32B (Instruct):</strong> Fast, direct. Good for “write this function” or “fix this error”.</li>
  <li><strong>DeepSeek R1 (Reasoning):</strong> Slow, verbose. It “thinks” via an internal chain-of-thought before outputting code.</li>
</ul>

<p>If you just want to have something chosen for you and get started, use Qwen as your default coding assistant. Use R1 when you are stuck on a hard bug and need a “second brain”.</p>

<h3 id="the-other-options">The other options</h3>

<table>
  <thead>
    <tr>
      <th>Model</th>
      <th>Size (Params)</th>
      <th>VRAM (Q4)</th>
      <th>Best for</th>
    </tr>
  </thead>
  <tbody>
    <tr>
      <td><strong>DeepSeek R1 Distill 32B</strong></td>
      <td>~32B</td>
      <td>~20GB</td>
      <td><strong>Complex Logic.</strong> See note above. Slower, but smarter at debugging.</td>
    </tr>
    <tr>
      <td><strong>DeepSeek Coder V2 Lite</strong></td>
      <td>~16B (MoE)</td>
      <td>~10GB</td>
      <td>Md-range GPUs 12GB (3060/4070).</td>
    </tr>
    <tr>
      <td><strong>Codestral 22B</strong></td>
      <td>~22B</td>
      <td>~14GB</td>
      <td>Good at the autocomplete thing.</td>
    </tr>
    <tr>
      <td><strong>Llama 3.1 70B</strong></td>
      <td>~70B</td>
      <td>~40GB</td>
      <td>For those lucky Mac Studio users.</td>
    </tr>
  </tbody>
</table>

<h2 id="setup-ollama--continuedev-easiest-path">Setup: Ollama + Continue.dev (easiest path)</h2>

<p>This is the stack I use. It effectively replaces the proprietary backend of Copilot with a local API server.</p>

<h3 id="1-install-ollama">1. Install Ollama</h3>

<div class="language-bash highlighter-rouge"><div class="highlight"><pre class="highlight"><code><span class="c"># macOS/Linux</span>
curl <span class="nt">-fsSL</span> https://ollama.com/install.sh | sh

<span class="c"># Windows: download from https://ollama.com/download</span>
</code></pre></div></div>

<h3 id="2-pull-a-model">2. Pull a model</h3>

<div class="language-bash highlighter-rouge"><div class="highlight"><pre class="highlight"><code>ollama pull qwen2.5-coder:7b    <span class="c"># 8GB VRAM</span>
ollama pull qwen2.5-coder:14b   <span class="c"># 16GB VRAM  </span>
ollama pull qwen2.5-coder:32b   <span class="c"># 24GB VRAM</span>
</code></pre></div></div>

<p>Don’t overthink it.</p>

<p>If you only have 8GB, the 7B model is still useful. It handles autocomplete, small refactors, and “write a test for this” perfectly well.</p>

<p>Where you’ll notice limits is on larger changes: multi-file refactors, architectural questions, or subtle logic bugs. For those, bigger models hold context better. But you do not need 24GB to get value.</p>

<h3 id="3-install-continuedev-in-vs-code">3. Install Continue.dev in VS Code</h3>

<ol>
  <li>Install the <a href="https://marketplace.visualstudio.com/items?itemName=Continue.continue">Continue extension</a></li>
  <li>Open settings and add your Ollama model</li>
</ol>

<p>That’s it. Autocomplete and chat now run locally.</p>

<h2 id="realistic-expectations-local-vs-cloud">Realistic expectations: local vs cloud</h2>

<p>Let’s be honest about the trade-offs:</p>

<table>
  <thead>
    <tr>
      <th>Aspect</th>
      <th>Local (Qwen 32B)</th>
      <th>Cloud (Sonnet 4.5)</th>
    </tr>
  </thead>
  <tbody>
    <tr>
      <td><strong>Quality</strong></td>
      <td>72.9% Aider</td>
      <td>84.2% Aider</td>
    </tr>
    <tr>
      <td><strong>Speed (chat)</strong></td>
      <td>20-40 tok/s</td>
      <td>50-100 tok/s</td>
    </tr>
    <tr>
      <td><strong>Speed (autocomplete)</strong></td>
      <td>Faster (no network)</td>
      <td>Slight latency</td>
    </tr>
    <tr>
      <td><strong>Cost</strong></td>
      <td>$0 (after hardware)</td>
      <td>$0.30/task</td>
    </tr>
    <tr>
      <td><strong>Setup</strong></td>
      <td>30 mins</td>
      <td>2 mins</td>
    </tr>
    <tr>
      <td><strong>Privacy</strong></td>
      <td>100% local</td>
      <td>Data sent to cloud</td>
    </tr>
  </tbody>
</table>

<h3 id="when-local-makes-sense">When local makes sense</h3>

<ul>
  <li><strong>Autocomplete</strong> - Local latency wins. A 7B model handles tab completion well, and the instant response feels snappier than cloud.</li>
  <li><strong>High volume</strong> - If you’re making hundreds of requests daily, local saves real money over time.</li>
  <li><strong>Privacy requirements</strong> - Regulated industries, proprietary code, air-gapped environments.</li>
  <li><strong>You already have the hardware</strong> - If you have a 4090 for gaming/ML, local coding is nearly free.</li>
</ul>

<h2 id="air-gapped--safe-and-secure">Air-gapped = safe and secure?</h2>

<p>“Privacy” is the headline benefit of local models - no data leaves your machine - and this sounds like a silver bullet. But it’s not so simple.</p>

<h3 id="what-air-gapping-does-solve">What air-gapping does solve</h3>

<p>Running locally solves “where is my data going?” - your code never hits OpenAI’s servers, never gets logged by Anthropic, never crosses network boundaries. But we still have the “what’s inside the box?” problem.</p>

<h3 id="the-supply-chain-risk">The supply chain risk</h3>

<p>Consider Qwen - currently the best local coding model. It’s developed by Alibaba, a Chinese company. For most developers, this is irrelevant. For some industries…</p>

<p><strong>Backdoors</strong>: Could a model be <a href="/ai-dev-faq/#fine-tuning">fine-tuned</a> to introduce subtle vulnerabilities when it recognises certain patterns? A buffer overflow here, a “sleeper” logic branch there - triggered by military-specific terminology or classified project structures.</p>

<p><strong>Training data poisoning</strong>: If the training set included insecure code patterns, the model will confidently suggest those patterns as “best practices.” It’s not malicious - it’s just pattern matching on bad examples.</p>

<p>This isn’t paranoia - it’s standard supply chain security thinking applied to a new domain. And it’s not theoretical: <a href="https://jfrog.com/blog/data-scientists-targeted-by-malicious-hugging-face-ml-models-with-silent-backdoor/">JFrog researchers found around 100 malicious models</a> on Hugging Face in 2024, including PyTorch models with working reverse shell backdoors. Simply <em>loading</em> the model - not even running inference - executed the payload.</p>

<h3 id="code-quality-risks">Code quality risks</h3>

<p>Even without supply chain concerns, local models have inherent limitations:</p>

<p><strong>Weaker reasoning</strong>: Smaller models (under 70B parameters) don’t reason as deeply as the major <a href="/ai-dev-faq/#frontier-model">cloud frontier models</a>. They’re more likely to suggest code that “works” without considering security or stability implications.</p>

<p><strong>Insecure patterns</strong>: LLMs replicate patterns from training data, including vulnerable ones (SQL injection, command injection, path traversal). The model doesn’t know these are vulnerabilities; they’re just patterns it learned.</p>

<p><strong>Stale knowledge</strong>: Open-source models are frozen at release. Qwen 2.5 Coder was trained on data up to mid-2024; cloud models like Claude and GPT-4 are updated more frequently. A local model might suggest a library with a known CVE or a deprecated API because its training predates the vulnerability disclosure.</p>

<h3 id="risk-comparison">Risk comparison</h3>

<table>
  <thead>
    <tr>
      <th>Risk</th>
      <th>Cloud (OpenAI/Anthropic)</th>
      <th>Local (air-gapped)</th>
    </tr>
  </thead>
  <tbody>
    <tr>
      <td><strong>Data exfiltration</strong></td>
      <td>High - sent to vendor</td>
      <td>Zero - isolated</td>
    </tr>
    <tr>
      <td><strong>Sovereign control</strong></td>
      <td>Limited - US-based providers dominate</td>
      <td>Depends on model origin</td>
    </tr>
    <tr>
      <td><strong>Supply chain/backdoors</strong></td>
      <td>Lower - vetted providers</td>
      <td>Higher - varied sources</td>
    </tr>
    <tr>
      <td><strong>Code vulnerabilities</strong></td>
      <td>Lower - stronger reasoning</td>
      <td>Higher - weaker models</td>
    </tr>
  </tbody>
</table>

<h3 id="practical-mitigations">Practical mitigations</h3>

<p>If you’re using local models in secure environments:</p>

<p><strong>1. Choose provenance carefully</strong></p>

<p>Consider models with transparent training lineages. Llama-based models from Meta, or fine-tunes from domestic contractors, may be more appropriate than Qwen for sensitive work - even if benchmarks are slightly lower.</p>

<p><strong>2. Never skip code review</strong></p>

<p>LLM-generated code should go through the same (or stricter) review process as human code. Automated static analysis tools like SonarQube or Snyk (offline versions exist) can catch common vulnerabilities.</p>

<p><strong>3. Sandbox everything</strong></p>

<p>Test AI-suggested code in isolated containers before integration. Assume it’s untrusted until proven otherwise.</p>

<h3 id="the-honest-take">The honest take</h3>

<p>Local models solve the data sovereignty problem. They don’t solve the “can I trust AI-generated code?” problem - that requires the same rigour you’d apply to any external code, plus awareness that LLMs pattern-match rather than reason about security.</p>

<p>For most secure environments, local models are viable with appropriate guardrails. But “local” doesn’t mean “safe” - it means “different threat model.”</p>

<h3 id="when-cloud-still-wins">When cloud still wins</h3>

<ul>
  <li><strong>Complex reasoning</strong> - For architecture decisions, multi-file refactors, or debugging tricky issues, Sonnet/GPT-5 still outperforms local.</li>
  <li><strong>You value your time</strong> - Setup, model management, and troubleshooting VRAM issues add friction.</li>
  <li><strong>Laptop users</strong> - Integrated graphics won’t cut it. Even a MacBook Pro with M3 Pro (18GB) is limited to ~14B models.</li>
</ul>

<h2 id="the-hybrid-approach">The hybrid approach</h2>

<p>Use both!</p>

<ol>
  <li><strong>Local for autocomplete</strong> - Qwen 7B or 14B via Ollama + Continue. Instant, no cost.</li>
  <li><strong>Local for simple tasks</strong> - Bash scripts, CLI automation, file manipulation, quick utility functions. A 14B model handles these fine.</li>
  <li><strong>Cloud for complex reasoning</strong> - Multi-file refactors, architecture decisions, debugging subtle issues. This is where Sonnet/GPT-5 earns its cost.</li>
</ol>

<p>The sweet spot: use local for the high-volume, low-complexity stuff (autocomplete, simple scripts), and cloud for the tasks where quality really matters.</p>

<h2 id="bottom-line---is-local-realistic-in-2026">Bottom line - is local realistic in 2026?</h2>

<ul>
  <li>For autocomplete: Yes, if you have 8GB+ VRAM</li>
  <li>For chat/reasoning: Yes, if you have a 4090 or M2 Max+</li>
  <li>For matching cloud quality: Not quite - but the gap is closing</li>
</ul>

<p>Qwen 2.5 Coder 32B running locally genuinely competes with GPT-4o. That was unthinkable two years ago. At this pace, local models matching Sonnet-class quality are probably going to happen by the end of 2026.</p>

<p>If you’re curious, start with Ollama + Qwen 7B. It takes 10 minutes to set up and costs nothing to try.</p>

<h2 id="sources">Sources</h2>

<ul>
  <li><a href="https://arxiv.org/abs/2409.12186">Qwen 2.5 Coder Technical Report</a> - Alibaba, September 2024</li>
  <li><a href="https://huggingface.co/Qwen/Qwen2.5-Coder-32B-Instruct">Qwen 2.5 Coder on Hugging Face</a></li>
  <li><a href="https://aider.chat/docs/leaderboards/">Aider LLM Leaderboards</a> - Paul Gauthier, updated regularly</li>
  <li><a href="https://ollama.com/library/qwen2.5-coder">Ollama Model Library</a></li>
  <li><a href="https://huggingface.co/spaces/Vokturz/can-it-run-llm">Can it run LLM?</a> - VRAM calculator</li>
  <li><a href="https://jfrog.com/blog/data-scientists-targeted-by-malicious-hugging-face-ml-models-with-silent-backdoor/">Malicious Hugging Face ML Models with Silent Backdoor</a> - JFrog Security Research, February 2024</li>
</ul>]]></content><author><name>Ben Hall</name></author><category term="AI" /><category term="Developer Tools" /><category term="ai" /><category term="local-llm" /><category term="coding" /><category term="ollama" /><category term="deepseek" /><summary type="html"><![CDATA[Can you run AI coding assistants locally? Yes - but with caveats. Here's what actually works, what hardware you need, and whether it's worth the hassle.]]></summary></entry><entry><title type="html">The Economic &amp;amp; Environmental Costs of AI Coding</title><link href="https://failingfast.io/the-real-cost-of-ai-coding-tools/" rel="alternate" type="text/html" title="The Economic &amp;amp; Environmental Costs of AI Coding" /><published>2025-12-20T00:00:00+00:00</published><updated>2025-12-20T00:00:00+00:00</updated><id>https://failingfast.io/the-real-cost-of-ai-coding-tools</id><content type="html" xml:base="https://failingfast.io/the-real-cost-of-ai-coding-tools/"><![CDATA[<p>Each interaction with an AI coding assistant carries costs that are not reflected in the subscription price. AI companies are losing billions of dollars while consuming vast amounts of energy and water. Understanding these hidden costs matters for developers making informed choices about how deeply they integrate these tools into their work.</p>

<div class="callout">
  I am setting aside the debate on 'AI technical debt' for this article. I believe existing engineering workflows can generally handle those risks (see <a href="/autocomplete-was-never-the-point/">my take here</a>), so I am focusing strictly on the external infrastructure costs.
</div>

<h2 id="the-financial-reality-is-investor-subsidies">The Financial Reality Is Investor Subsidies</h2>

<h3 id="openai">OpenAI</h3>

<p>OpenAI’s financial position in September 2024, according to reporting by the <em>New York Times</em>:</p>

<ul>
  <li><strong>Monthly revenue</strong>: $300 million (August 2024)</li>
  <li><strong>Projected 2024 revenue</strong>: $3.7 billion</li>
  <li><strong>Estimated 2024 losses</strong>: approximately $5 billion</li>
  <li><strong>Revenue growth</strong>: 1,700% since early 2023</li>
  <li><strong>Funding raised</strong>: approximately $7 billion at a $150 billion valuation (reported across multiple outlets, October 2024)</li>
</ul>

<p>That equates to roughly <strong>$1.35 lost for every $1 earned</strong>. The revenue does not cover the compute, infrastructure, research, and staffing costs required to operate frontier models at scale.</p>

<h3 id="anthropic">Anthropic</h3>

<p>Anthropic’s growth follows a similar pattern. Public disclosures through 2024 show rapid enterprise adoption and aggressive fundraising, including multi-billion-dollar rounds led by strategic partners.</p>

<p>The company does not publish detailed profit and loss figures, but the scale and pace of investment strongly suggest ongoing operating losses as it prioritises growth, capacity, and model development over near-term profitability.</p>

<h2 id="what-does-this-mean-for-pricing">What Does This Mean for Pricing?</h2>

<p>The prices developers see today, whether Copilot at £19 per month or Claude Pro at £17 per month when billed annually, are almost certainly below the true cost of delivery.</p>

<p>The pattern is familiar:</p>

<ol>
  <li>Subsidise usage to acquire users</li>
  <li>Build habits, workflows, and switching costs</li>
  <li>Raise prices once market position stabilises</li>
</ol>

<p>We saw this with Uber. Early pricing felt implausibly cheap. It was. Once subsidies receded, prices adjusted to economic reality.</p>

<h3 id="api-pricing-a-subsidised-race">API Pricing: A Subsidised Race</h3>

<p>API pricing makes this dynamic clearer. In 2023, a typical GPT-4 coding task (around 50K input and 10K output tokens) could cost roughly $2.00. By late 2025, comparable tasks are far cheaper.</p>

<table>
  <thead>
    <tr>
      <th>Model (late 2025)</th>
      <th>Approx. $/task</th>
      <th>vs GPT-4 (2023)</th>
    </tr>
  </thead>
  <tbody>
    <tr>
      <td>Claude Sonnet 4.5</td>
      <td>$0.30</td>
      <td>~6.7× cheaper</td>
    </tr>
    <tr>
      <td>GPT-4.1 mini</td>
      <td>$0.03</td>
      <td>~67× cheaper</td>
    </tr>
    <tr>
      <td>Gemini 2.5 Flash</td>
      <td>$0.04</td>
      <td>~50× cheaper</td>
    </tr>
  </tbody>
</table>

<p>These figures are illustrative rather than exact equivalence, but the trend is clear.</p>

<p>Has efficiency really improved fifty to sixty-seven times in two years? Possibly. But providers are also competing aggressively on price, with investors absorbing much of the cost. No one wants to lose ground during a land grab.</p>

<h3 id="wont-efficiency-fix-this">Won’t Efficiency Fix This?</h3>

<p>Improving efficiency absolutely helps, and it is happening. But lower cost per request does not automatically mean lower total cost.</p>

<p>As inference becomes cheaper, it becomes easier to justify using AI more often, in more places, by more people. Features that once felt extravagant become default. Background agents appear. Always-on assistance creeps in. Total system load rises faster than unit costs fall.</p>

<p>Developers have seen this pattern before. Cheaper resources change behaviour. Unless usage is deliberately constrained, efficiency gains tend to increase demand rather than cap it.</p>

<h2 id="the-environmental-cost-for-developers">The Environmental Cost (for Developers)</h2>

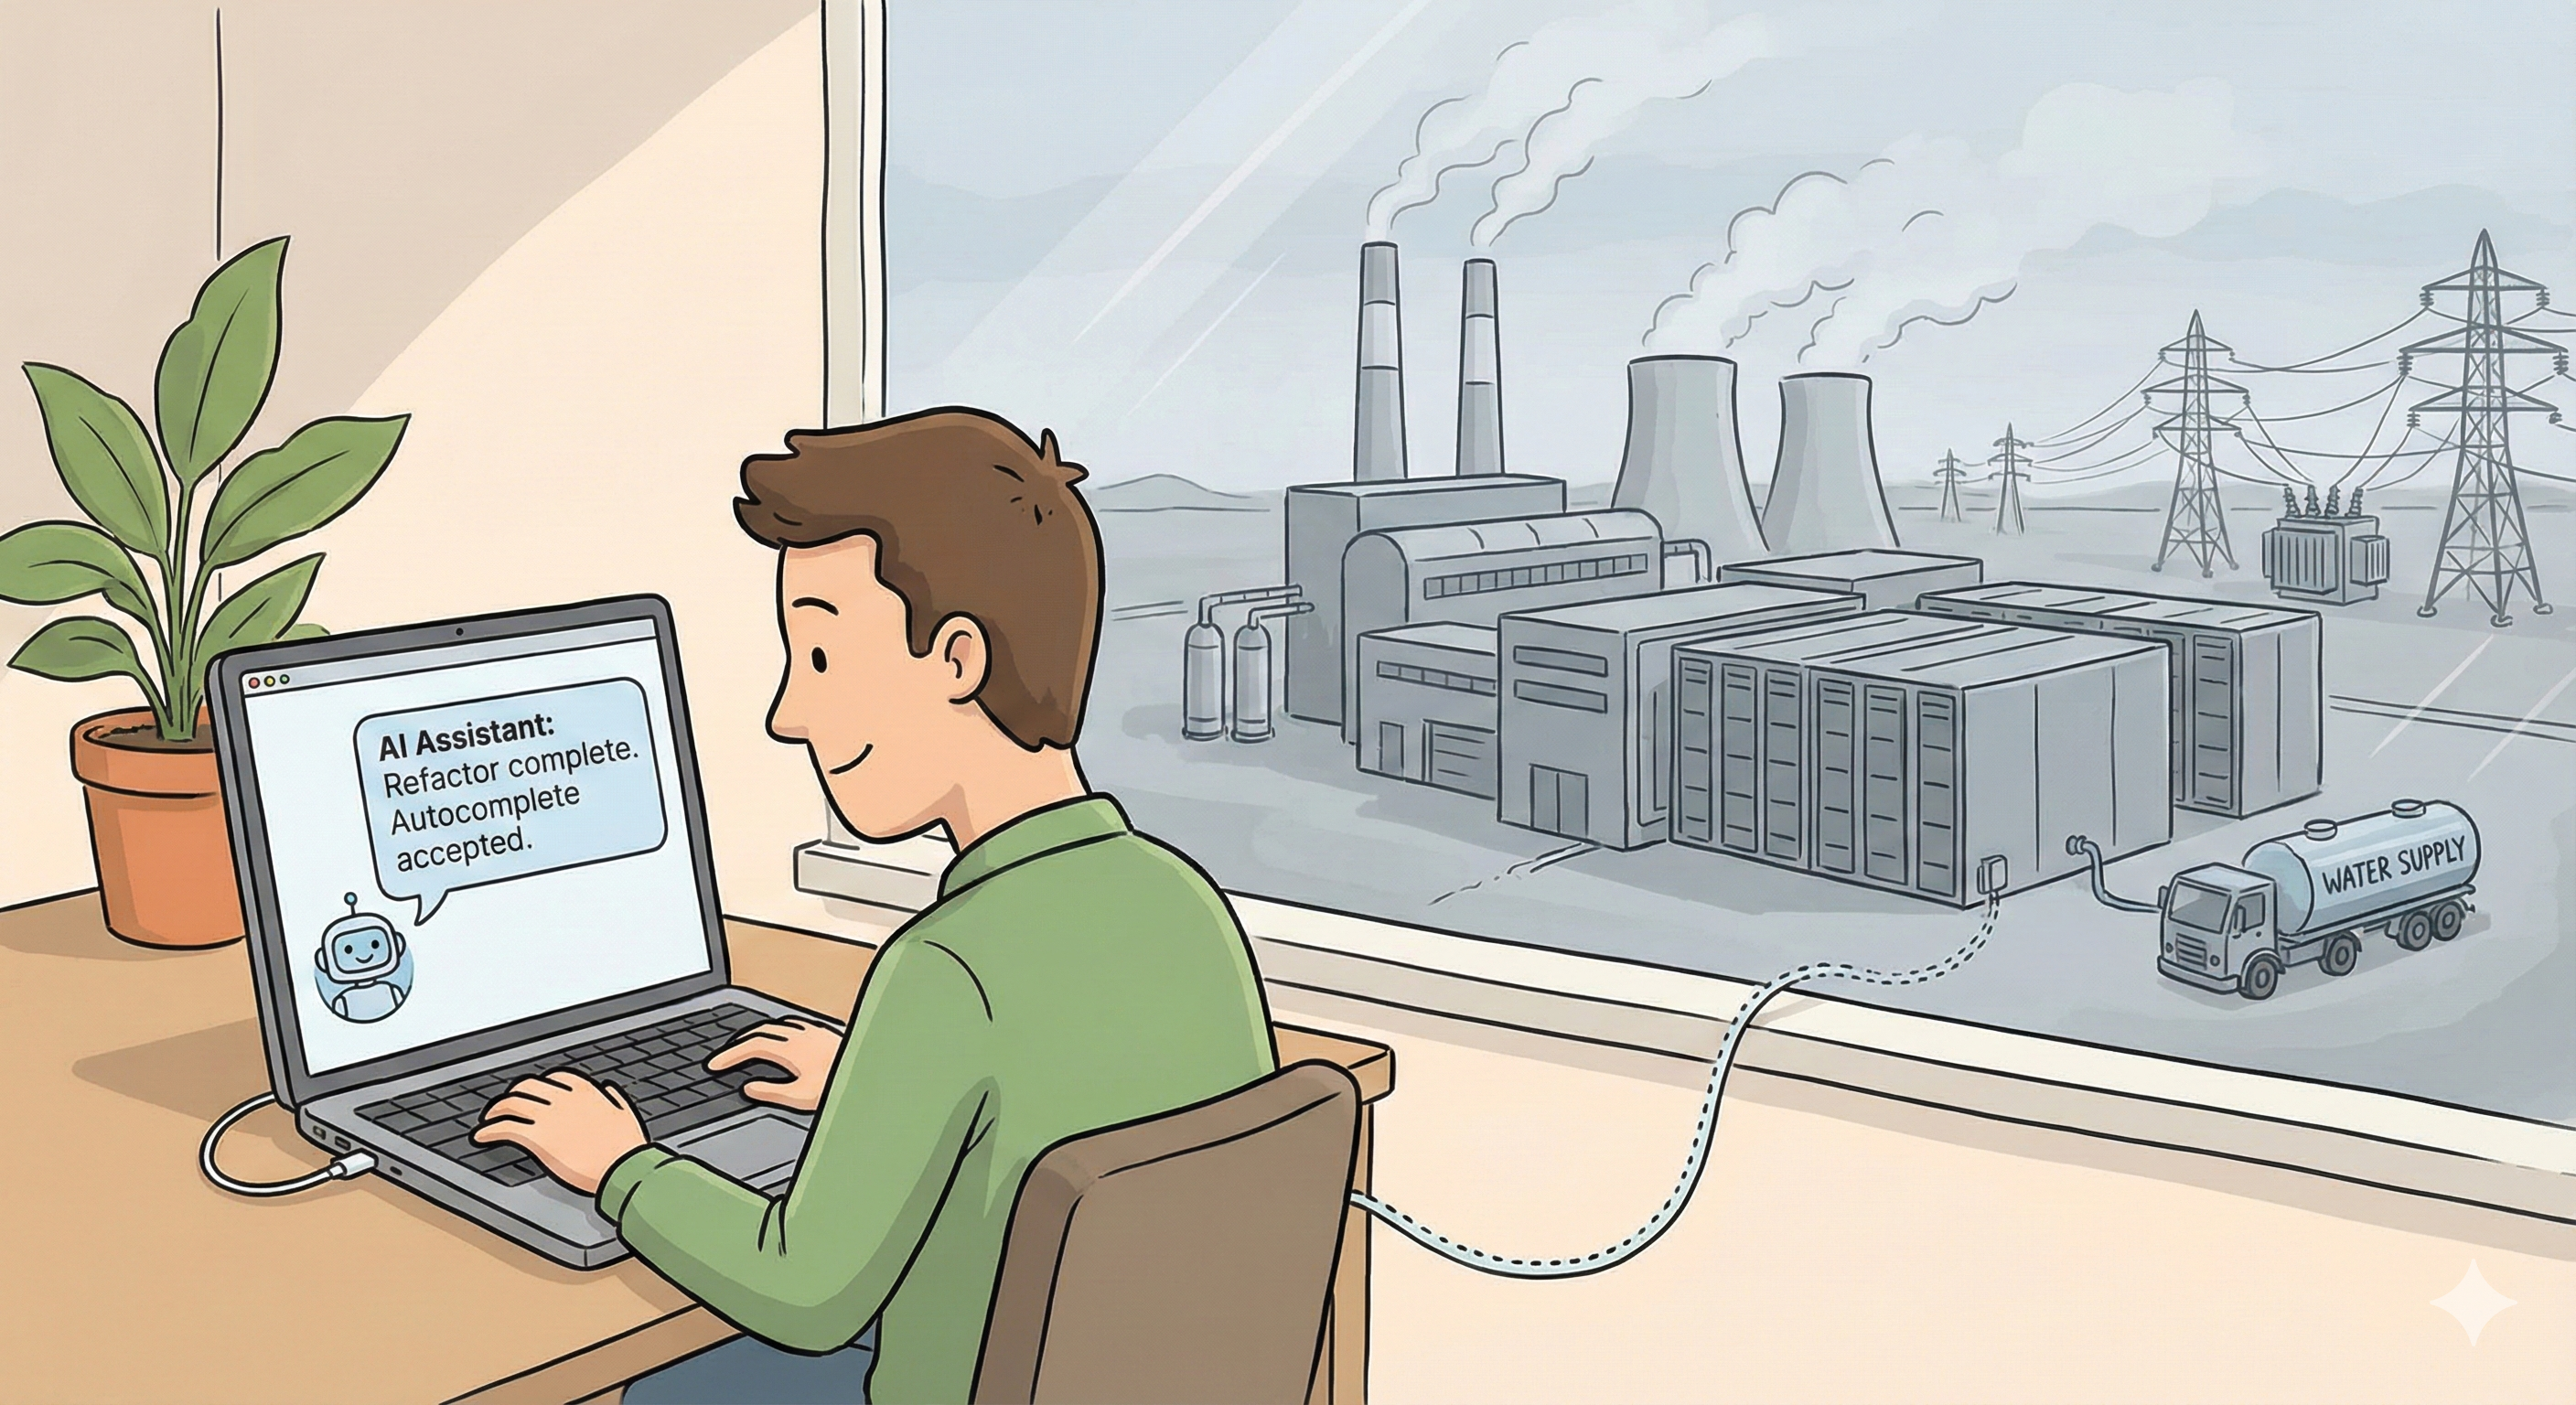
<p><a href="/assets/images/2025-12-20-the-real-cost-of-ai-coding-tools/realcost2.png" class="image-popup">
  <img src="/assets/images/2025-12-20-the-real-cost-of-ai-coding-tools/realcost2.png" alt="Illustration showing a relaxed software developer working at a laptop, while a large industrial data centre with cooling towers and power infrastructure operates in the distance, highlighting the hidden cost of AI behind a simple interface." style="width: 64%; float: right; margin-left: 14px; margin-top: 12px; margin-bottom: 14px;" />
</a></p>

<p>From a software development perspective, AI usage behaves less like running a compiler and more like making a remote call to a large, continuously operating data centre. The cost is externalised, but it is still real.</p>

<p>Every prompt triggers compute across clusters of GPUs, backed by power delivery, cooling, redundancy, and networking. The abstraction is clean. The system underneath is not.</p>

<h3 id="energy-consumption">Energy Consumption</h3>

<p>The exact energy cost per prompt is not public, but the direction of travel is clear.</p>

<p>We often fixate on the training costs—the massive energy spike required to <em>build</em> a model. While those numbers are huge (Strubell et al. showed way back in 2019 that training one model could emit as much CO₂ as five cars), they are essentially a one-off ‘capital expenditure’.</p>

<p>The real, ongoing cost is <strong>inference</strong>.</p>

<p>This is the energy used every time the model answers a question. Unlike training, which ends once the model is released, inference runs 24/7. Every time you hit Tab or ask for a refactor, you aren’t retrieving a cached file; you are triggering a fresh, complex calculation on a GPU. It scales linearly with every user. It’s the difference between the energy to build a car and the fuel needed to drive it every day.</p>

<p>The International Energy Agency’s <em>Electricity Report 2024</em> projects that global data centre electricity demand will roughly double by 2026. AI workloads are a primary driver. In some regions, additional demand is being met by keeping older fossil-fuel plants online rather than by new renewable capacity.</p>

<p>From a systems point of view, this is a classic scaling problem: latency and reliability expectations increase faster than clean energy supply can adapt.</p>

<h3 id="water-and-cooling">Water and Cooling</h3>

<p>Compute density creates heat. Heat must be removed.</p>

<p>Large data centres rely heavily on water-intensive cooling, particularly in warm or water-stressed regions. Microsoft’s 2025 Sustainability Report highlights that newer direct-to-chip cooling systems can save over 125 million litres of water per facility each year.</p>

<p>That figure is useful precisely because it implies how much water traditional cooling consumes.</p>

<p><strong>For engineers, the key point is that cooling is not an optimisation detail. It is a hard constraint that determines rack density, data centre placement, and how fast AI infrastructure can scale at all.</strong></p>

<h3 id="carbon-offsets-are-a-lagging-fix">Carbon Offsets Are a Lagging Fix</h3>

<p>Major providers have made serious sustainability commitments:</p>
<ul>
  <li>Microsoft aims to be carbon negative by 2030</li>
  <li>Google targets 24/7 carbon-free energy by 2030</li>
</ul>

<p>These programmes involve real investment and real progress. They also exist because current operations generate a substantial footprint.</p>

<p>Offsets and renewable contracts operate at organisational timescales. Inference demand grows at product timescales. The gap between the two is where environmental cost accumulates.</p>

<h2 id="what-should-developers-do">What Should Developers Do?</h2>

<h3 id="1-factor-in-future-pricing">1. Factor in Future Pricing</h3>

<p>Assume today’s prices are temporary.</p>

<p>Ask yourself:</p>
<ul>
  <li>What productivity gains are you actually seeing?</li>
  <li>Could your workflow survive if prices doubled?</li>
  <li>Are you building dependencies that would be painful to unwind?</li>
</ul>

<h3 id="2-match-the-model-to-the-task">2. Match the Model to the Task</h3>

<p>Using a large reasoning model for trivial completions is like driving a lorry to pick up groceries.</p>

<p>In practice:</p>
<ul>
  <li>Smaller models for autocomplete and boilerplate</li>
  <li>Mid-tier models for everyday development</li>
  <li>Top-tier models only for genuinely complex reasoning and large code reviews</li>
</ul>

<p>This is a cost decision and an efficiency decision.</p>

<p>See <a href="/ai-coding-guide/">my quick picks</a> to match model to task. Updated monthly.</p>

<h3 id="3-consider-local-models">3. Consider Local Models</h3>

<p>For high-volume work or privacy-sensitive code, local models can be compelling. Tools such as Qwen 2.5 Coder (32B) achieve strong coding benchmarks with zero per-query cost once running.</p>

<p>See <a href="/local-coding-ai-models/">my article</a> on the current state of local coding AI models.</p>

<h3 id="4-stay-informed">4. Stay Informed</h3>

<p>AI pricing and capabilities will keep changing. What is subsidised today may not be tomorrow.</p>

<p>Personally, I am finding Copilot’s pricing multipliers and broad model selection useful, because they make cost explicit at the point of use, directly inside my IDE.</p>

<h2 id="the-bottom-line">The Bottom Line</h2>

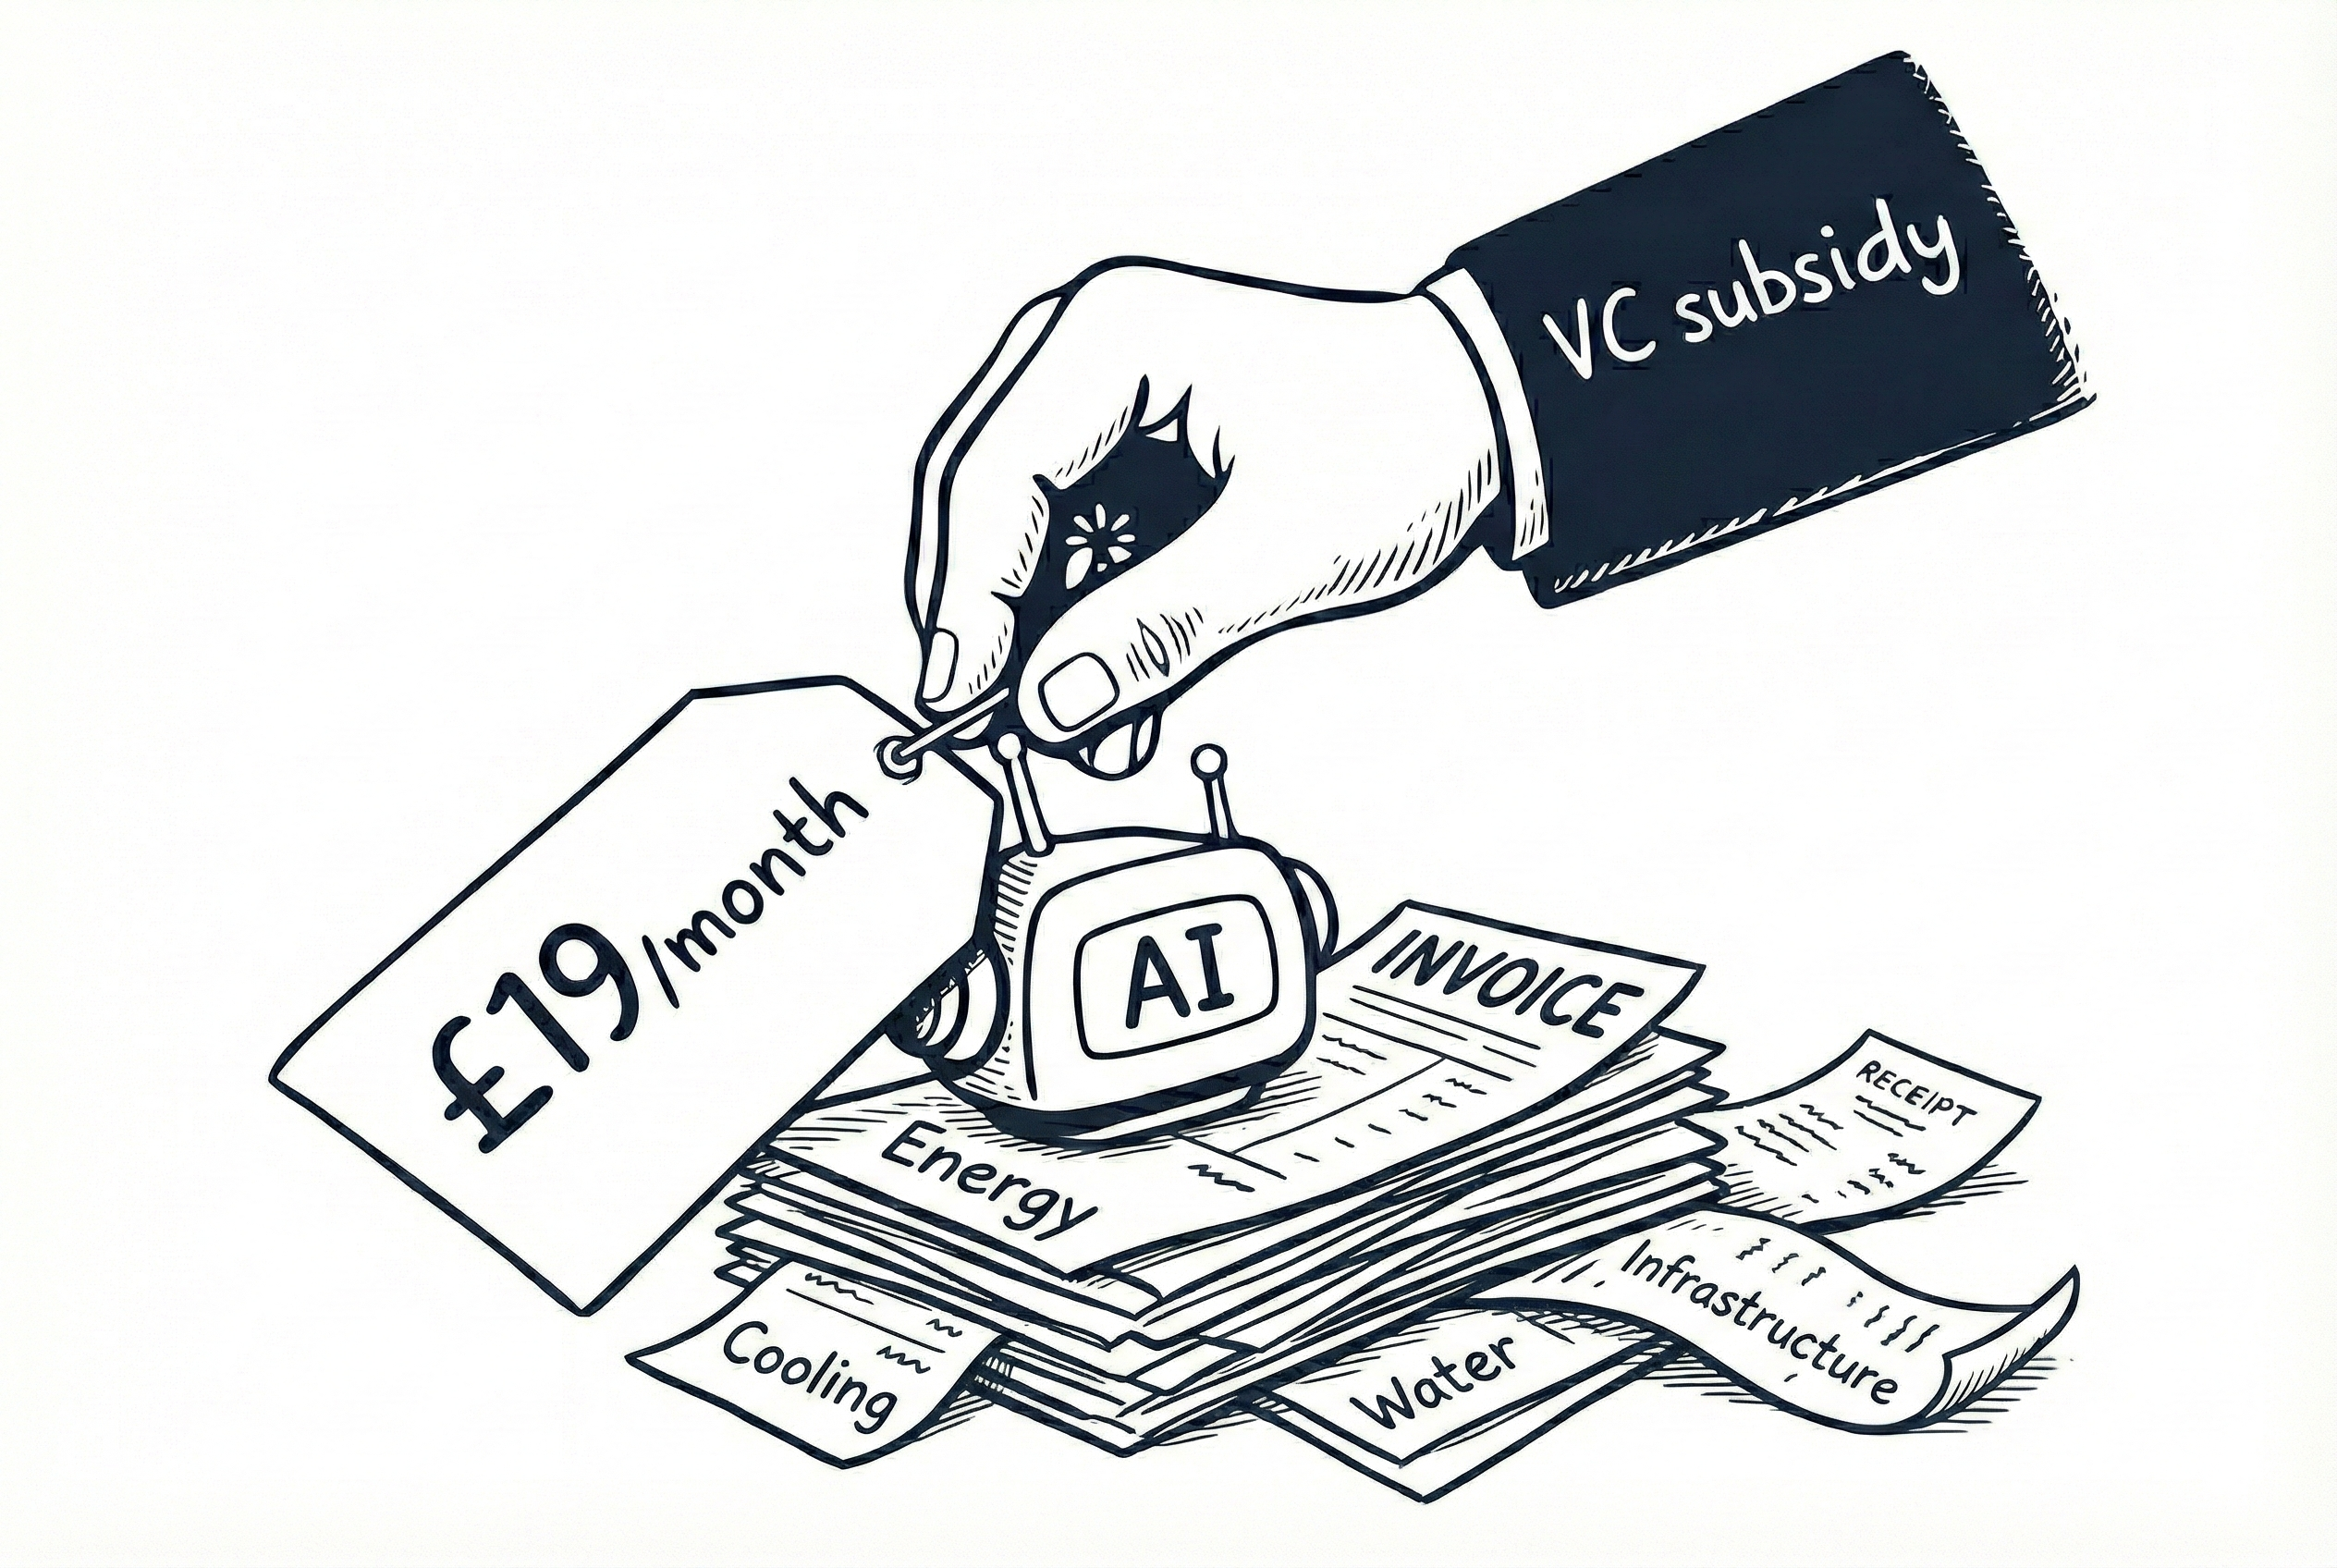
<p><a href="/assets/images/2025-12-20-the-real-cost-of-ai-coding-tools/realcost.png" class="image-popup">
  <img src="/assets/images/2025-12-20-the-real-cost-of-ai-coding-tools/realcost.png" alt="Illustration: A £19/month AI tool price tag held down by VC subsidy, while externalised infrastructure costs (compute, energy, water) accumulate underneath." style="width: 55%; float: right; margin-left: 20px; margin-top: 12px; margin-bottom: 14px;" />
</a></p>

<p>AI coding tools are remarkable, <em>and</em> remarkably subsidised.</p>

<p>OpenAI’s multi-billion-dollar annual losses and Anthropic’s aggressive fundraising are not a stable end state. Even with continued efficiency gains, always-on inference at scale will not be free.</p>

<p>At some point, the system must rebalance through some combination of:</p>
<ol>
  <li>Further efficiency gains</li>
  <li>Higher prices or stricter usage limits</li>
  <li>Consolidation as weaker players exit</li>
</ol>

<p>None of this means developers should avoid AI tools. They offer real value today. But understanding the true costs helps you decide how deeply to depend on them.</p>

<p>The electricity powering your prompts, the water cooling the data centres, the billions of investor dollars underwriting each response: those are the real costs of AI. Today, you are not paying them directly. But someone is.</p>

<h2 id="sources">Sources</h2>

<ul>
  <li>New York Times, “OpenAI Is Growing Fast and Burning Through Piles of Money” (September 2024)</li>
  <li>Anthropic public fundraising disclosures (2023–2024)</li>
  <li>Microsoft Environmental Sustainability Report 2025</li>
  <li>IEA Electricity Report 2024</li>
  <li>Strubell, Ganesh, McCallum, “Energy and Policy Considerations for Deep Learning in NLP” (ACL 2019)</li>
  <li>Google Sustainability Reports</li>
</ul>]]></content><author><name>Ben Hall</name></author><category term="AI" /><category term="Development" /><category term="AI" /><category term="copilot" /><category term="claude" /><category term="openai" /><category term="environment" /><category term="sustainability" /><summary type="html"><![CDATA[Behind the affordable AI coding assistants lies an uncomfortable truth: massive investor subsidies, billion-dollar losses, and growing environmental costs. What happens when the subsidy ends?]]></summary></entry><entry><title type="html">Listen to me on the Day 2 Cloud podcast</title><link href="https://failingfast.io/opentelemetry-podcast/" rel="alternate" type="text/html" title="Listen to me on the Day 2 Cloud podcast" /><published>2023-04-27T00:00:00+01:00</published><updated>2023-04-27T00:00:00+01:00</updated><id>https://failingfast.io/opentelemtry-podcast</id><content type="html" xml:base="https://failingfast.io/opentelemetry-podcast/"><![CDATA[<p><img src="/assets/images/podcast192.png" alt="image-center" class="align-right" /></p>

<p>I was recently invited to be a guest on the Day 2 Cloud podcast (part of the Packet Pushers network), that covers DevOps and cloud-ops topics. The conversation was quite engaging, and although the episodes typically run for 40 minutes, we managed to fill an entire hour!</p>

<p>In the podcast, we discussed OpenTelemetry and observability, which are not only areas of personal interest but should absolutely be something we are looking at for our long-term tech strategies. For those of you who have already heard me discuss these topics, I think this podcast presents a more dynamic and in-depth exploration.</p>

<p><strong>You can listen to the episode here: <a href="https://packetpushers.net/podcast/day-two-cloud-192-opentelemetry-getting-from-visibility-to-observability-with-ben-hall/">Day Two Cloud 192: OpenTelemetry - Getting From Visibility To Observability With Ben Hall - Packet Pushers</a></strong>.</p>

<p>Or get a link to your favourite podcast player: <a href="https://pod.link/1460004936/episode/20e545a2b4fd8e48142eb4a23e67d4ce">Day 2 Cloud (pod.link)</a></p>

<p>I hope you find the conversation insightful and enjoyable. Please feel free to share your thoughts, questions, or feedback in the comments or with me directly.</p>]]></content><author><name>Ben Hall</name></author><category term="Support" /><category term="OpenTelemetry" /><category term="Observability" /><summary type="html"><![CDATA[I was invited to chat with the Packet Pushers folk on 'OpenTelemetry – Getting From Visibility To Observability With Ben Hall'. Looks like I pushed a show that's typically around 40 minutes long, over an hour for my guest appearance. Hope it's a good listen and you learn something new, audience!]]></summary></entry><entry><title type="html">OpenTelemetry, The Missing Ingredient</title><link href="https://failingfast.io/opentelemetry/" rel="alternate" type="text/html" title="OpenTelemetry, The Missing Ingredient" /><published>2022-10-16T00:00:00+01:00</published><updated>2022-10-16T00:00:00+01:00</updated><id>https://failingfast.io/opentelemtry</id><content type="html" xml:base="https://failingfast.io/opentelemetry/"><![CDATA[<ul>
  <li><a href="/opentelemetry-observability">Part 1: The Modern Observability Problem</a></li>
  <li>Part 2: OpenTelemetry, The Missing Ingredient</li>
</ul>

<hr />
<p><br /></p>

<p>In <a href="/opentelemetry-observability">Part 1</a>, we looked at the observability challenges for modern systems - microservices, composable architectures, event-driven, shared components - all that good stuff solving problems well. But they’re really hard to support. We emphasised the importance of the right data being instrumented and we concluded that there are many good observability solutions, both open-source and commercial. But they all do things their own way, greatly reducing our ability to flex and adapt - letting our old opponent vendor lock-in through the door.</p>

<p><img src="/assets/images/opentelemetry/otel.png" alt="image-center" class="align-center" /></p>

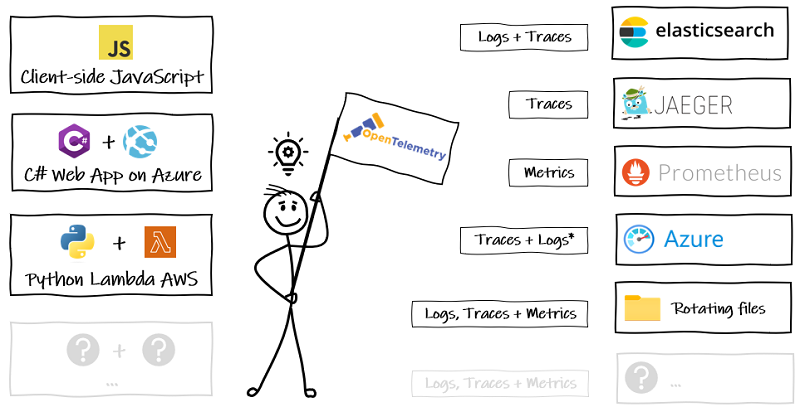
<p>In this article, we’ll look at how OpenTelemetry bridges the gap between our code and the observability backend options, supporting a <strong>move away from vendor-specific tooling</strong> for generating and exporting telemetry data.</p>

<h2 id="a-quick-refresher">A Quick Refresher</h2>

<p>Before we get started, let’s refresh our terminology from <a href="/opentelemetry-observability">Part 1</a>:</p>

<p><img src="/assets/images/opentelemetry/refresher.png" alt="image-center" class="align-right" /></p>

<ul>
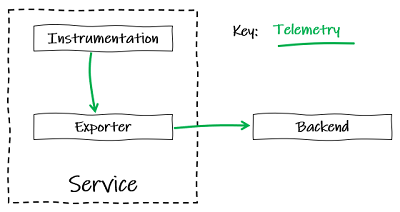
  <li><strong>Instrumentation</strong> is what produces the telemetry. When we talk about instrumenting, we mean to add libraries and/or code to our applications to collect telemetry such as logs, metrics and traces.</li>
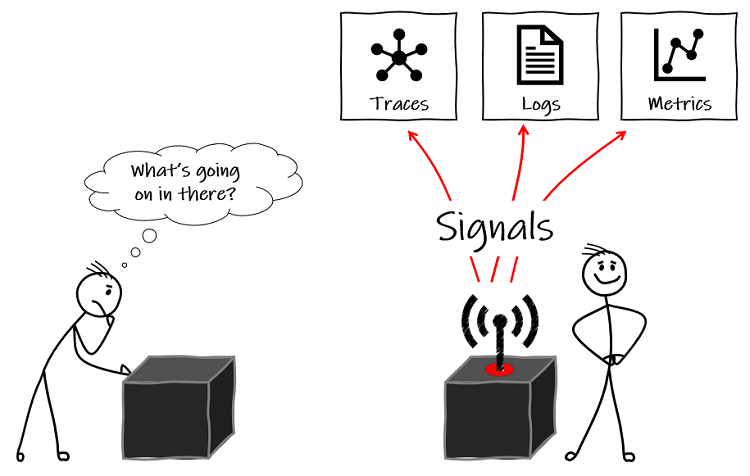
  <li><strong>Telemetry</strong> are insights into the behaviour or inner workings of a system – the data that the system emits about what’s happening inside the ‘black box’, collected via instrumentation. You may also hear these being called signals.</li>
</ul>

<h2 id="a-vendor-neutral-standard">A Vendor-Neutral Standard</h2>

<p>At its core, OpenTelemetry (OTel) is a vendor-neutral standard for telemetry across languages. You only need to instrument your code once and can then easily change to other observability backends when your needs change.</p>

<p>It is also means you can stick with your backend of choice while being able to change the language you use - all supported languages will adhere to the same API specification for instrumentation.</p>

<h2 id="more-than-a-vendor-neutral-standard">More Than A Vendor-Neutral Standard</h2>

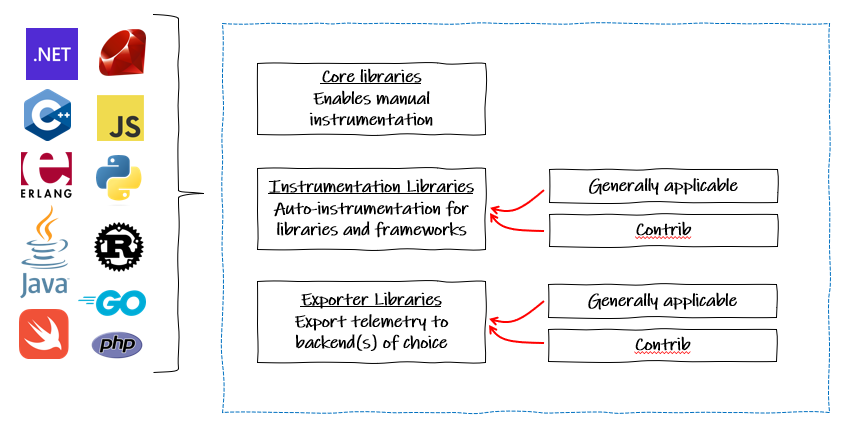
<p>OTel also provides <strong>a complete end-to-end implementation</strong> for generating, emitting, collecting, processing and exporting telemetry data to any supported observability back-end. For each language currently supported there core libraries, automatic instrumentation libraries, and exporters.</p>

<p><img src="/assets/images/opentelemetry/otel-libs.png" alt="image-center" class="align-center" /></p>

<h3 id="core-libraries">Core libraries</h3>

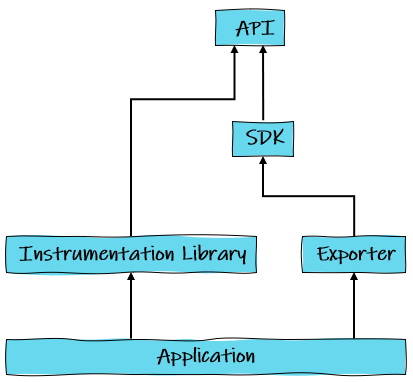
<p><strong>The API</strong> is the bare bones interface for instrumentation - no actual telemetry data will be sent to a backend. It’s been done this way because third party libraries wishing to instrument their code should not need to be concerned with how the consuming application implements its OpenTelemetry.</p>

<p><strong>The SDK</strong> is the complete language library that provides implementations of the API so we can instrument our code manually. It is what we pull directly into our applications. It doesn’t implement exporters, which are separate libraries that take a dependency on the SDK. Alternative instrumentation are available in separate libraries implementing the API.</p>

<p><img src="/assets/images/opentelemetry/sdk2.png" alt="image-center" class="align-center" /></p>

<p>Typically, any application that we wish to hook up to a observability backend with OTel will take dependencies on both of these indirectly, through dependencies on instrumentation libraries and exporters.</p>

<h3 id="instrumentation-libraries">Instrumentation Libraries</h3>

<p>Plugin-and-go for many common libraries and frameworks, such as those for web and databases. For example, we can generate telemetry data automatically for ASP.NET Core incoming web requests and outgoing Entity Framework requests. The only steps required are adding the two packages:</p>

<ul>
  <li>OpenTelemetry.Instrumentation.AspNetCore</li>
  <li>OpenTelemetry.Contrib.Instrumentation.EntityFrameworkCore</li>
</ul>

<p>And adding them as services in code:</p>

<div class="language-csharp highlighter-rouge"><div class="highlight"><pre class="highlight"><code> <span class="k">public</span> <span class="k">void</span> <span class="nf">ConfigureServices</span><span class="p">(</span><span class="n">IServiceCollection</span> <span class="n">services</span><span class="p">)</span>
<span class="p">{</span>
    <span class="n">services</span><span class="p">.</span><span class="nf">AddOpenTelemetryTracing</span><span class="p">((</span><span class="n">builder</span><span class="p">)</span> <span class="p">=&gt;</span> <span class="n">builder</span>
        <span class="p">.</span><span class="nf">AddAspNetCoreInstrumentation</span><span class="p">()</span>
        <span class="p">.</span><span class="nf">AddEntityFrameworkCoreInstrumentation</span><span class="p">()</span>
        <span class="c1">// Add your exporter(s) here</span>
    <span class="p">);</span>
<span class="p">}</span>
</code></pre></div></div>

<p>The OTel project maintains instrumentation and exporter packages for key OSS projects and compliance with the OTel specification, in its main repository for each language. For .NET this is <a href="https://github.com/open-telemetry/opentelemetry-dotnet/tree/main/src">open-telemetry/opentelemetry-dotnet</a>. Many others are then available from a sister contrib repository, which for .NET is <a href="https://github.com/open-telemetry/opentelemetry-dotnet-contrib">open-telemetry/opentelemetry-dotnet-contrib</a>.</p>

<h3 id="exporters">Exporters</h3>

<p>Exporters are libraries to send the instrumented telemetry data to backends. This can be through the OpenTelemetry Protocol (OTLP) itself - and that is the long-term goal<strong>*</strong>, or vendor-specific such as Jaegar or Azure Monitor, where the exporter library would translate from the OpenTelemetry data in memory, to the format used by a vendor tool. The availability of these types of exporters makes it much easier to plan and execute a transition to OTLP.</p>

<p><strong>*</strong>Vendors are increasingly offering full support for direct ingress of native OTLP. See <a href="https://opentelemetry.io/vendors/">this list</a> for updates. The Jaeger docs now even state:</p>

<blockquote>
  <p>As of 2022, the Jaeger SDKs are no longer supported, and all users are advised to migrate to OpenTelemetry.</p>
</blockquote>

<h2 id="vendor-neutral-tracing">Vendor-Neutral Tracing</h2>

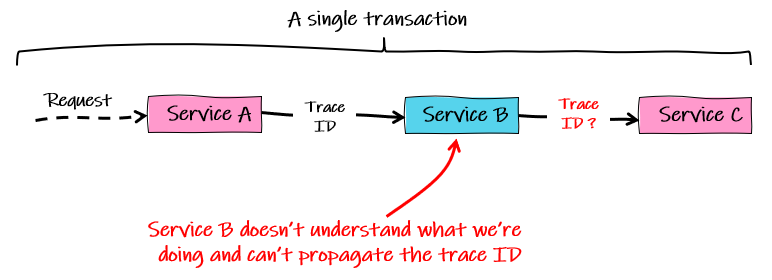
<p>One of the biggest challenges I’ve faced when debugging distributed systems is getting visibility the complete end-to-end journey of a transaction through all the services involved.</p>

<p>In <a href="/opentelemetry-observability">part 1</a> we introduced distributed tracing as a key part of any observability solution to solve just this problem. We acknowledged that there are many open-source and commercial products that do this already by propagating a trace ID between all operations in a transaction to tie everything together.</p>

<p>But more often than not, we end up with an incomplete picture that the business just accept as a risk, despite the increased effort for support. Some common causes of this include:</p>

<ul>
  <li>Services on mixed tech stacks require different solutions and resource constraints prevent us from instrumenting all of them</li>
  <li>Vendor lock-in, where our chosen backend does not support the tech stack of some of our services</li>
  <li>Clients and agents to instrument and send telemetry are built in-house and resource constraints prevent us from maintaining them for all service tech stacks</li>
</ul>

<p><img src="/assets/images/opentelemetry/missing-id.png" alt="image-center" class="align-center" /></p>

<p>As a single standard for tech stacks and backends, OTel eliminates these challenges. It brings a complete set of tools that really do simply plug in, to greatly reduce the resourcing required, and because it is an open standard, very little resources are required to switch to (or add) other backends.</p>

<h3 id="how-opentelemetry-does-tracing">How OpenTelemetry Does Tracing</h3>

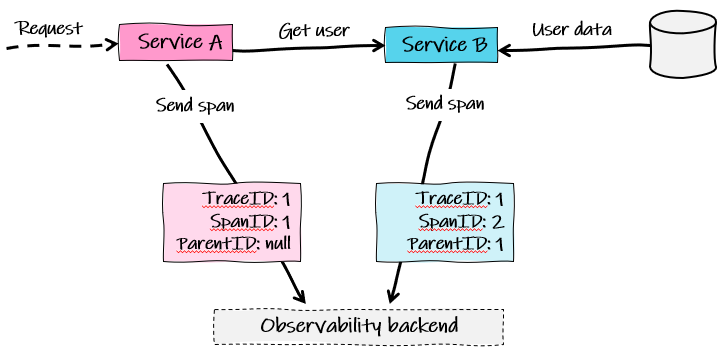
<p>OTel represents each operation in a trace across a system with the concept of a <strong>span</strong>. Amongst other things <a href="https://github.com/open-telemetry/opentelemetry-specification/blob/main/specification/overview.md#spans">defined in the OTel specification</a>, each span will hold:</p>

<ul>
  <li>A unique trace ID for the whole ‘journey’ of the current transaction through the system</li>
  <li>A unique ID for the span itself</li>
  <li>A unique ID for the parent span so we can reconstruct the journey in an observability backend</li>
</ul>

<p><img src="/assets/images/opentelemetry/sendspans.png" alt="image-center" class="align-center" /></p>

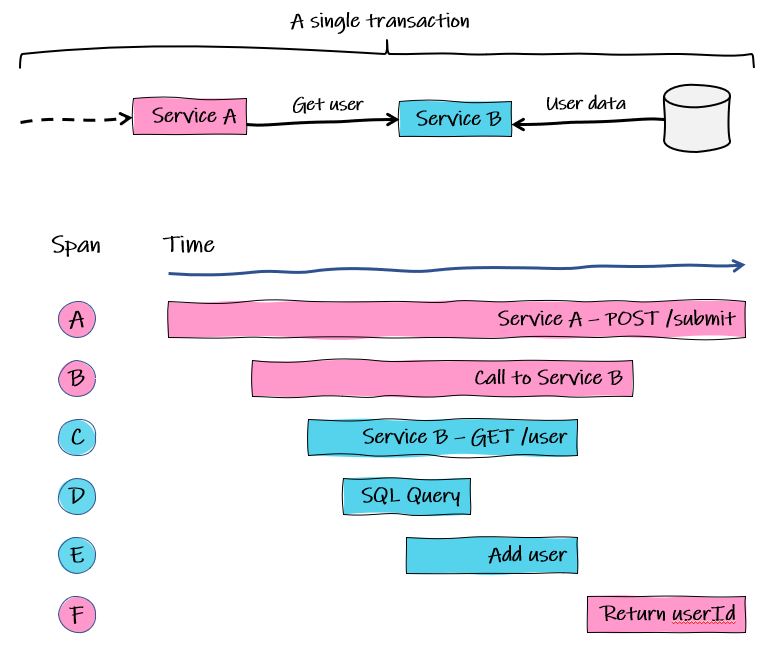
<p>Each span represents a single operation in the overall transaction through a system. Most backends will represent these against time, in a way you might be familiar with from <a href="https://en.wikipedia.org/wiki/Gantt_chart">Gantt charts</a>.</p>

<p><img src="/assets/images/opentelemetry/chart.png" alt="image-center" class="align-center" /></p>

<p>In this simplified example:</p>

<ol>
  <li><strong>Span A</strong>: request comes into Service A for user details. This is the <strong>root span</strong> and of course, parent to <strong>span B</strong>. Most mainstream web frameworks will be able to auto-instrument this, meaning it will automatically create a trace span for this incoming request.</li>
  <li><strong>Span B</strong>:Service A calls Service B to get a user’s details. We might get this from a library to auto-instrument HTTP calls or we could manually add a trace signal ‘around’ the code that makes the call.</li>
  <li><strong>Span C</strong>: Service B receives the request.</li>
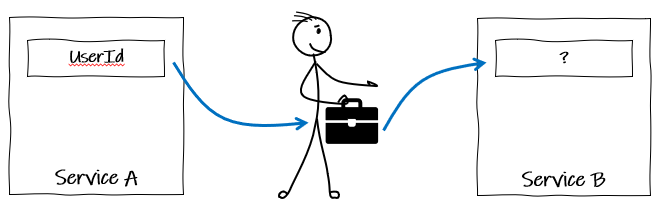
  <li><strong>Span D</strong>: Inside the code to handle the request, a child span represents an SQL query to the database for the user details.</li>
  <li><strong>Span E</strong>: We manually instrument a signal for adding then user if it is not found.</li>
  <li><strong>Span F</strong>: Service B has returned the user details and Service A returns that data to the caller, which is auto-instrumented by our web framework.</li>
</ol>

<h2 id="vendor-neutral-context-propagation">Vendor-Neutral Context Propagation</h2>

<p>OTel uses the concept of <strong>baggage</strong>, which standardises the format of a shared context for values across programming languages and platforms, removing the need for teams to develop their own custom solutions for propagating shared data.</p>

<p>For example, if only <code class="language-plaintext highlighter-rouge">service A</code> sees a user’s ID, we could put in the baggage so that <code class="language-plaintext highlighter-rouge">service B</code> could access in when called as a child/dependency.</p>

<p><img src="/assets/images/opentelemetry/baggage.png" alt="image-center" class="align-center" /></p>

<h2 id="the-collector-a-vendor-neutral-proxy">The Collector: A Vendor-Neutral Proxy</h2>

<p>The star of the show in my opinion, is the <strong>collector</strong>. While most languages have exporters to send telemetry data directly to back-ends, which is fine during development, it is beneficial to offload data quickly to a collector to handle the resource intensive tasks, such as:</p>

<ul>
  <li>Exporting to multiple places</li>
  <li>Enhancing with metadata</li>
  <li>Batching</li>
  <li>Encryption</li>
  <li>Buffering and retries when the back-ends are unresponsive</li>
  <li>Control flow to back-ends to allow service to continue its work</li>
</ul>

<p>The collector can receive and export data in multiple formats, to and from observability tools using the OpenTelemetry Procotol (OTLP) and proprietary ones. It does his by acting as a <strong>pipeline</strong> through receivers, processors and exporters.</p>

<p><img src="/assets/images/opentelemetry/pipeline.png" alt="image-center" class="align-center" /></p>

<h3 id="receivers">Receivers</h3>

<p>Receivers are how telemetry signals are ingressed from sources into the collector before being processed and sent on to observability backends.</p>

<p>The core receiver is for telemetry using OTLP but there are many more available from the <a href="https://github.com/open-telemetry/opentelemetry-collector-contrib/tree/main/receiver">contrib repository</a> to support vendor formats and translate these to OTLP:</p>

<ul>
  <li>A <a href="https://github.com/open-telemetry/opentelemetry-collector-contrib/tree/main/receiver/filelogreceiver">file log receiver</a> that will tail and parse logs from files.</li>
  <li>A <a href="https://github.com/open-telemetry/opentelemetry-collector-contrib/tree/main/receiver/jaegerreceiver">Jaeger Receiver</a>, if you have an existing services exporting traces to Jaegar, these can be redirected to your collector and exported to new backends alongside the existing Jaegar instance.</li>
  <li>A <a href="https://github.com/open-telemetry/opentelemetry-collector-contrib/tree/main/receiver/k8sclusterreceiver">Kubernetes cluster receiver</a> that collects cluster-level metrics from the k8s API server.</li>
</ul>

<h3 id="processors">Processors</h3>

<p>Processors can be run on data between receiving and exporting. Some examples:</p>

<ul>
  <li>A <a href="https://github.com/open-telemetry/opentelemetry-collector-contrib/tree/main/processor/redactionprocessor">redaction processor</a> that can be configured to prevent sensitive information leaking into traces.</li>
  <li>A <a href="https://pkg.go.dev/github.com/open-telemetry/opentelemetry-collector-contrib/processor/k8sattributesprocessor">k8s attributes processor</a>  that can automatically tag telemetry passing through the collector with k8s metadata.</li>
  <li>A <a href="https://github.com/open-telemetry/opentelemetry-collector/tree/main/processor/batchprocessor">batch processor</a> to reduce the number of outgoing connections used to transmit to backends.</li>
</ul>

<h3 id="exporters-1">Exporters</h3>

<p>Similar to the libraries used directly by applications, these are used to send data to observability backends or other destinations from the collector.</p>

<p>As well as the core OTLP exporter, there are many available from the <a href="https://github.com/open-telemetry/opentelemetry-collector-contrib/tree/main/exporter">contrib repository</a></p>

<h3 id="the-sidecar-pattern">The Sidecar Pattern</h3>

<p>Below is a snapshot of a typical use-case. We have a .NET web app exporting logs, metrics and traces using OTLP to a collector. It also shows how we might choose to transition while continuing to output file logs, pulling them into the collector using the <a href="https://github.com/open-telemetry/opentelemetry-collector-contrib/tree/main/receiver/filelogreceiver">file log receiver</a>.</p>

<p>This method of deployment depicted is where a collector is deployed alongside each service on a one-to-one basis, with a shared lifetime with the service. This tends to put ownership of the collector with the development team(s) and is useful if you need to do processing specific to a service.</p>

<p><img src="/assets/images/opentelemetry/collector2.png" alt="image-center" class="align-center" /></p>

<p>Our collector could then be setup as a pipeline to export those to the back-ends of our choosing.</p>

<p>The configuration for that pipeline would like this (<a href="https://gist.github.com/benbhall/04b3ec79b6a1934be586efbf06a0ef21">complete config file</a>):</p>

<div class="language-yaml highlighter-rouge"><div class="highlight"><pre class="highlight"><code><span class="na">service</span><span class="pi">:</span>
  <span class="na">pipelines</span><span class="pi">:</span>
    <span class="na">traces</span><span class="pi">:</span>
      <span class="na">receivers</span><span class="pi">:</span> <span class="pi">[</span><span class="nv">otlp</span><span class="pi">]</span>
      <span class="na">exporters</span><span class="pi">:</span> <span class="pi">[</span><span class="nv">otlp</span><span class="pi">,</span> <span class="nv">elasticsearch/trace</span><span class="pi">]</span>
    <span class="na">logs</span><span class="pi">:</span>
      <span class="na">receivers</span><span class="pi">:</span> <span class="pi">[</span><span class="nv">otlp</span><span class="pi">]</span>
      <span class="na">exporters</span><span class="pi">:</span> <span class="pi">[</span><span class="nv">otlp</span><span class="pi">,</span> <span class="nv">elasticsearch/log</span><span class="pi">,</span> <span class="nv">file/rotation_with_default_settings</span><span class="pi">]</span>
    <span class="na">metrics</span><span class="pi">:</span>
      <span class="na">receivers</span><span class="pi">:</span> <span class="pi">[</span><span class="nv">otlp</span><span class="pi">]</span>
      <span class="na">exporters</span><span class="pi">:</span> <span class="pi">[</span><span class="nv">otlp</span><span class="pi">,</span> <span class="nv">prometheus</span><span class="pi">]</span>
</code></pre></div></div>

<h3 id="as-a-single-gateway">As a Single Gateway</h3>

<p>It’s also possible to deploy the collector as standalone <strong>gateway</strong> component, to be scaled independently of the services. This tends to mean ownership of the collector is with platform teams who can then centrally manage policies and permission.</p>

<p><img src="/assets/images/opentelemetry/collector1.png" alt="image-center" class="align-center" /></p>

<p>The ideal setup is for each service or collection of services to have dedicated collectors as agents, owned by the development team. These would export to an instance run as a gateway by the ops teams to apply their own processes such as authentication or metadata.</p>

<h2 id="summary">Summary</h2>

<p>Observability solutions, both open-source and commercial, have done a good job in catching up with the demands of supporting complex modern architectures. The big unsolved problem was the lack of standards, which reduced our ability to flex and adapt, resulting in some level of vendor lock-in.</p>

<p>OpenTelemetry is the missing ingredient, which is set to change the landscape significantly. It is very easy to adopt with a real plug-and-play feel to it, and there is good transition support with libraries to translate between proprietary protocols and OpenTelemetry.</p>

<p>For the .NET readers, <a href="https://github.com/benbhall/opentelemetry-demo">fire up my demo repository</a> and have a go at using OpenTelemetry with .NET and Azure Monitor.</p>

<p><strong>EDIT April 2023</strong>: Listen to me on the Day Two Cloud, a Packet Pushers podcast, talking about OpenTelemetry. <a href="https://packetpushers.net/podcast/day-two-cloud-192-opentelemetry-getting-from-visibility-to-observability-with-ben-hall/">Use this direct link</a> or listen on your favourite podcast platform via <a href="https://pod.link/1460004936/episode/20e545a2b4fd8e48142eb4a23e67d4ce">pod.link</a>.</p>]]></content><author><name>Ben Hall</name></author><category term="Support" /><category term="OpenTelemetry" /><category term="Observability" /><summary type="html"><![CDATA[At its core, OpenTelemetry (OTel) is a vendor-neutral standard for telemetry. But it also provides a complete end-to-end implementation for generating, emitting, collecting, processing and exporting telemetry data to any support observability back-end.]]></summary></entry><entry><title type="html">The Modern Observability Problem</title><link href="https://failingfast.io/opentelemetry-observability/" rel="alternate" type="text/html" title="The Modern Observability Problem" /><published>2022-10-15T00:00:00+01:00</published><updated>2022-10-15T00:00:00+01:00</updated><id>https://failingfast.io/opentelemtry-observability</id><content type="html" xml:base="https://failingfast.io/opentelemetry-observability/"><![CDATA[<ul>
  <li>Part 1: The Modern Observability Problem</li>
  <li><a href="/opentelemetry">Part 2: OpenTelemetry, The Missing Ingredient</a></li>
</ul>

<hr />
<p><br /></p>

<p><img src="/assets/images/opentelemetry/stack3.png" alt="image-center" class="align-right" /></p>

<p>Debugging an application in a single process tends to be easy 💪 and most of what goes wrong with our monoliths will already be recorded as known problems, with standard solutions. We may even have automated their fixes. But if not, we know there are finite routes through the application, and that tracing the cause of most problems is relatively trivial.</p>

<p>But the complexity of interactions in large, modern microservice architectures produces novel, one-off errors, that cross boundaries in space and time. Factor in components being built on a broad mix of tech stacks, and we have a proper challenge supporting them.</p>

<p>Imagine just a small number of services like those represented in the diagram below. We have a mix of synchronous REST communication and asynchronous<strong>*</strong> events. If we get an error in <code class="language-plaintext highlighter-rouge">service H</code> because of something that happened in <code class="language-plaintext highlighter-rouge">service B</code>, this would be non-trivial to investigate - without the right information.</p>

<p><img src="/assets/images/opentelemetry/microservices.png" alt="image-center" class="align-center" /></p>

<p><strong>*</strong> Synchronous HTTP calls will request and receive a response at the same time. Of course sometimes it might take a few seconds, but quick enough so that we can easily link it to any side effects it might have. Asynchronous communications, like events, won’t necessarily trigger an instant response. It could even be a day before an event added to some queue is processed! Clearly, it won’t be as easy to assign blame for some side effect to an event.</p>

<h3 id="visibility-is-not-observability">Visibility is not Observability</h3>

<p>Observability and monitoring are two different things. We’re usually pretty good at monitoring, or if that fails, the users will shout at us. Either way, we tend to know <em>when</em> there is a problem. We don’t always do so well at answering the <em>why</em> questions.</p>

<p>That, for me, is the core observability problem: <strong>Why is the system exhibiting this behaviour?</strong></p>

<p>And if you’re doing observability right, you should be able to answer that question without having to redeploy with additional logs or ‘prints’.</p>

<p>If you can only answer questions about predictable problems - that’s monitoring, not observability.</p>

<h2 id="telemetry-and-the-three-pillars-of-observability">Telemetry and the Three Pillars of Observability</h2>

<ul>
  <li>Your car dashboard displaying how much fuel is left in the tank</li>
  <li>When you filter log output from your code in a tool like Kibana</li>
  <li>When you’ve looked at a histogram of events passing through your servers</li>
</ul>

<p>These are all examples of <strong>telemetry</strong> – insights into the behaviour or inner workings of a system – the data that the system emits about what’s happening inside the ‘black box’. You may also hear these being called <strong>signals</strong>.</p>

<p>And <strong>instrumentation</strong> is what <em>produces</em> the telemetry. When we talk about instrumenting, we mean to add libraries and/or code to our applications that collects telemetry such as logs, metrics and traces.</p>

<p><img src="/assets/images/opentelemetry/signals2.png" alt="image-center" class="align-center" /></p>

<p>In software engineering, we often to simplify telemetry to three distinct things:</p>

<p><strong>Logs</strong>: More specifically, centralised logging – shipping all the text log entries from our components to a single data source to easily draw correlations with searches. Logs typically describe in some detail, what is happening, so are expensive to store a long time. They are not always tied to a specific user/request and thus lack context, but nonetheless, are still heavily relied on to understand system behaviour.</p>

<p><strong>Metrics</strong>: Typically focusing on reliability, the type of stuff discussed for service level indicators (SLIs) and service level agreements (SLAs). As they are largely numerical data like counters and rates, they use significantly less storage than logging. This means it can be kept for longer, allowing for better analysis of trends over time. Caution though, size can increase with complexity – the cardinality – how much extra data we attach to each metric to make them more useful.</p>

<p><strong>Traces</strong>: More specifically, distributed tracing. Think of this as <strong>a stack trace across multiple components</strong> (and boundaries) of a distributed or large system. It offers some of the analytical benefits of metrics but with the cardinality of logging. Distributed tracing also relies on <strong>context propagation</strong>, a component to move shared information and identifiers used to associate traces, between the services.</p>

<p>With tracing instrumented across all our services, properly correlated with logs, then in our fictional system we could see the route our imaginary transaction has taken, leading us to the problem service(s), which in our imagined scenario, is some dodgy data in <code class="language-plaintext highlighter-rouge">service F</code> and the code in <code class="language-plaintext highlighter-rouge">service B</code> not gracefully handling it, such that the error didn’t surface until <code class="language-plaintext highlighter-rouge">service H</code>.</p>

<p><img src="/assets/images/opentelemetry/microservices2.png" alt="image-center" class="align-center" /></p>

<p>A typical observability tool view of traces and logs, if an exception was thrown in <code class="language-plaintext highlighter-rouge">service B</code> after it was called from <code class="language-plaintext highlighter-rouge">service A</code> would be like the image below. With it, we can see exactly what call from <code class="language-plaintext highlighter-rouge">service A</code> made the request and drill down into it further to see associated logs and get a complete picture of the overall transaction.</p>

<p><img src="/assets/images/opentelemetry/ai-spans.png" alt="image-center" class="align-center" /></p>

<p>We’ll look at traces in more detail for <a href="/opentelemetry">part 2, on OpenTelemetry</a>.</p>

<p>Ultimately, logs, metrics, and traces are the well-established ‘3 pillars’ of observability, but there are others, like health checks. Whichever way we choose to break it down, we often have raw telemetry data in varying formats and structures that need to be processed and correlated to answer questions about the behavior of our system.</p>

<h2 id="what-is-the-right-telemetry">What is the Right Telemetry?</h2>

<p>Shift away from that monitoring state of mind where you’re looking for problems you can predict, and make sure your system emits enough of the right telemetry to allow you to troubleshoot the problems you cannot foresee, because microservice architectures in a production environment will provide plenty of those! <strong>Emitting the right telemetry is what makes a system observable</strong>.</p>

<p>What actually stops internal users working or external customers getting what they need done?</p>

<p>What’s the business value of each service?</p>

<p>Keen an open dialogue with your colleagues in the business to understand what questions about the system  matter to them. Use this to decide what is the right data to be instrumented.</p>

<p>This turns observability into a more powerful tool that can be use for what..if scenarios and forecasting.</p>

<h2 id="the-technology-problem">The Technology Problem</h2>

<p><img src="/assets/images/opentelemetry/tech1.png" alt="image-center" class="align-center" /></p>

<p>We have our applications built in a mix of technologies (and more) here on the left, doing stuff we want to know about (this is intentionally getting more complicated as we purposefully shift to composed architectures and smaller microservices).</p>

<p>And we have all these options on the right (and more) that we might want to use to collect and analyse what the things on the left are doing.</p>

<p>The reality will be a bit of all of it. Some files, some custom database, maybe one team has gone their own way with elastic on prem., another in the cloud. All emitting telemetry signals but not necessarily in the same format, which means it becomes really difficult to get a joined up picture of what is going on in side the black box. For example:</p>

<ul>
  <li>You’re not going to be able to aggregate logs and run queries across the system if they’re not using a shared format. I’ve seen log shipping agents written to reformat logs but maintaining the agents and clients to do this, across tech stacks, uses a lot of resources.</li>
  <li>I’ve witnessed confusion between teams, each trying to find out what they should be adding to some common context in a transaction across services owned by a number of teams. A gap that can be easily be filled by establishing a standard but standards take time and effort to build in-house.</li>
</ul>

<h3 id="vendor-lock-in">Vendor Lock-in</h3>

<p>It’s okay to roll our own database or file logging and utilise the abstractions provided by our language frameworks. But at scale, we need the powerful features of dedicated self-hosted or SaaS observability solutions. The problem, is that they instrument code in their own way, which makes it a non-trivial piece of work to switch to a different solution.</p>

<p>We call this ‘vendor lock-in’ and its effects go both ways:</p>

<ul>
  <li>Our services all depend on the logging solution they are now plumbed into</li>
  <li>The logging solution will only support X and Y tech stacks, limiting our freedom to change these for our services</li>
</ul>

<p>Sure, if you have a handful of C# web applications and that’s all you ever make, then maybe it is okay to lock into specific observability backends:</p>

<p><img src="/assets/images/opentelemetry/tech2.png" alt="image-center" class="align-center" /></p>

<p>But we can’t predict the future and we don’t want to create future legacy.</p>

<h2 id="summary">Summary</h2>

<p><img src="/assets/images/opentelemetry/observable.png" alt="image-center" class="align-right" /></p>

<p>To resolve problems in a large microservice system:</p>

<ul>
  <li>We must be able to find out <em>why</em> they have occurred.</li>
  <li>For this, our system must be observable.</li>
  <li>To be observable, a system needs to be instrumented such that the code emits telemetry, which is typically logs, traces and metrics.</li>
  <li>This telemetry must be sent to a backend that supports joining up that telemetry data and answering questions about the system’s behaviour.</li>
</ul>

<p>There are lots of open-source and commercial backends, available as self-hosted or SaaS, many of which are really good at this. The problem, is that they all do things in their own ways - there is no standard. Plumbing our logging, metrics and traces into all our services is a big task, meaning when you have done it once for any vendor, you probably won’t be doing it again any time soon, greatly reducing your freedom to be flexible and adapt.</p>

<p>OpenTelemetry (OTeL) is the evolution of ideas from the OpenTracing and OpenCensus projects, to build a single, vendor-neutral standard. We’ll look at this in <strong><a href="/opentelemetry">Part 2: OpenTelemetry, The Missing Ingredient</a></strong>.</p>

<p><strong>EDIT April 2023</strong>: Listen to me on the Day Two Cloud, a Packet Pushers podcast, talking about OpenTelemetry. <a href="https://packetpushers.net/podcast/day-two-cloud-192-opentelemetry-getting-from-visibility-to-observability-with-ben-hall/">Use this direct link</a> or listen on your favourite podcast platform via <a href="https://pod.link/1460004936/episode/20e545a2b4fd8e48142eb4a23e67d4ce">pod.link</a>.</p>]]></content><author><name>Ben Hall</name></author><category term="Support" /><category term="OpenTelemetry" /><category term="Observability" /><summary type="html"><![CDATA[The observability problem - Why is the system exhibiting this behaviour?]]></summary></entry><entry><title type="html">\`Charbonneau Loops\’ and government IT contracting</title><link href="https://failingfast.io/charbonneau/" rel="alternate" type="text/html" title="\`Charbonneau Loops\’ and government IT contracting" /><published>2022-10-13T00:00:00+01:00</published><updated>2022-10-13T00:00:00+01:00</updated><id>https://failingfast.io/charbonneau</id><content type="html" xml:base="https://failingfast.io/charbonneau/"><![CDATA[<p>A quick post to share a link to this interesting read about outsourcing and in-house capacity, which I can relate to working in public sector IT: <a href="https://sboots.ca/2022/10/12/charbonneau-loops-and-government-it-contracting/">‘Charbonneau Loops’ and government IT contracting</a>.</p>

<p>We’re working hard in our little software engineering corner at <a href="https://www.gov.uk/government/organisations/homes-england">Homes England</a> to build a strong, permanent development capability, and to establish Digital as a directorate that can deliver larger products. We’re not doing this so that we can build everything. But rather, to avoid passing a tipping point, outsourcing more, where developers and testers either leave, or their skillsets become obsolete. Then not only do we lose the knowledge to oversee outsourced work, but we are also not able to support it.</p>

<p><a href="https://twitter.com/xiaopu">Xiaopu Fung</a>, who works in the Canadian public sector, captured it well:</p>

<blockquote>
  <p>We need to build and ship in order to keep flexing our in-house capacity muscles, otherwise we atrophy.</p>
</blockquote>]]></content><author><name>Ben Hall</name></author><category term="Software Teams" /><category term="outsourcing" /><summary type="html"><![CDATA[An interesting read about outsourcing and in-house capacity, relevant to us in IT.]]></summary></entry><entry><title type="html">GitOps with Terraform, GitHub and Azure</title><link href="https://failingfast.io/gitops/" rel="alternate" type="text/html" title="GitOps with Terraform, GitHub and Azure" /><published>2022-06-17T00:00:00+01:00</published><updated>2022-06-17T00:00:00+01:00</updated><id>https://failingfast.io/gitops</id><content type="html" xml:base="https://failingfast.io/gitops/"><![CDATA[<p>Microsoft commissioned me to write a three-part series to demonstrate how to construct a complete end-to-end GitOps workflow using Terraform plans, GitHub, GitHub Actions, and Azure.</p>

<p>All three were published on Code Project and can be read through the links below:</p>

<ul>
  <li><a href="https://www.codeproject.com/Articles/5334970/Introduction-to-GitOps">Introduction to GitOps</a>. This article takes a look at GitOps — its origins, what it actually is, and how it relates to the term IaC and the pipeline concepts of CI and CD.</li>
  <li><a href="https://www.codeproject.com/Articles/5334971/GitOps-with-Terraform-and-GitHub">GitOps with Terraform and GitHub</a>. In this article, you will see a hands-on tutorial that shows how to take a simple Terraform plan that deploys some simple Azure infrastructure (such as VMs), and commits the code to a GitHub repository. Then, you will learn how to make changes to the code in a fork or branch, commit the changes, and do code review on the changes using a pull request.</li>
  <li><a href="https://www.codeproject.com/Articles/5334972/GitOps-with-Azure-Terraform-and-GitHub-Part-3-GitO">GitOps Provisioning with GitHub Actions</a>. This article gives you hands-on experience in constructing a CI/CD pipeline that provisions changes that have been merged into a Terraform plan via a pull request. You will also see how to use automated checks to support the code review process in ‘gating’ deployments, and review the end-to-end process for making changes and seeing those changes in the live Azure resources.</li>
</ul>]]></content><author><name>Ben Hall</name></author><category term="GitOps" /><category term="gitops" /><category term="azure" /><category term="github" /><category term="github actions" /><summary type="html"><![CDATA[A 3-part series published on CodeProject that demonstrates how to construct a complete end-to-end GitOps workflow using Terraform plans, GitHub, GitHub Actions, and Azure.]]></summary></entry><entry><title type="html">Manual Docker Setup on Windows</title><link href="https://failingfast.io/docker-wsl-2/" rel="alternate" type="text/html" title="Manual Docker Setup on Windows" /><published>2021-12-11T00:00:00+00:00</published><updated>2021-12-11T00:00:00+00:00</updated><id>https://failingfast.io/docker-on-wsl</id><content type="html" xml:base="https://failingfast.io/docker-wsl-2/"><![CDATA[<p>If, like me, you’re moving between a number of environments for development, you may not always have access to Docker Desktop.</p>

<p>Well, don’t panic! It is still possible to get up and running in Windows without Docker Desktop. Why? Because we’re developers with super powers and there is <em>nothing</em> we cannot do when we’re given the time to solve a problem.</p>

<p>Notice I said ‘given the time’ - just because we can, doesn’t mean we should all of the time.  It’s complicated and comes with an ongoing commitment to maintaining it all - not ideal for productivity, and your security team won’t be pleased if you don’t keep everything patched.</p>

<p>That said, there have been occasions when Docker Desktop has not been available to me and it has been useful to know how to use Docker in Windows, nonetheless.</p>

<p>In this article I’ll walk you through the process that I follow with Windows Subsystem for Linux (WSL) 2 that lives in a small executable, wsl.exe, in c:\windows\system32. It will allow us to run Linux containers natively on Windows, without emulation.</p>

<h2 id="prerequisites">Prerequisites</h2>

<p>These are shared with Docker Desktop so, if you had previously setup Docker Desktop, you may not need to complete these.</p>

<ol>
  <li>Install Windows 10 version 1903 or higher or Windows 11.</li>
  <li>Enable the WSL 2 feature on Windows.</li>
  <li>Download and install the Linux kernel update package.</li>
</ol>

<h2 id="creating-a-wsl-2-distribution">Creating a WSL 2 Distribution</h2>

<p>1. First, install a Linux distro on WSL 2 - either from the Microsoft Store or from the command line. I’m using Ubuntu in this example.</p>

<div class="language-powershell highlighter-rouge"><div class="highlight"><pre class="highlight"><code><span class="n">wsl</span><span class="w"> </span><span class="nt">--install</span><span class="w"> </span><span class="nt">-d</span><span class="w"> </span><span class="nx">Ubuntu</span><span class="w">
</span></code></pre></div></div>

<p>2. When the installation completes, an automatic process to create a non-root user begins. Other distros may require you to configure a non-root user and sudo access yourself.</p>

<p>3. You should also confirm the command installed WSL 2 (not v1):</p>

<div class="language-powershell highlighter-rouge"><div class="highlight"><pre class="highlight"><code><span class="n">wsl</span><span class="w"> </span><span class="nt">--list</span><span class="w"> </span><span class="nt">--verbose</span><span class="w">
</span></code></pre></div></div>

<p>4. And if it did not, run the following command to upgrade it to v2:</p>

<div class="language-powershell highlighter-rouge"><div class="highlight"><pre class="highlight"><code><span class="n">wsl</span><span class="w"> </span><span class="nt">--set-version</span><span class="w"> </span><span class="nx">Ubuntu</span><span class="w"> </span><span class="nx">2</span><span class="w">
</span></code></pre></div></div>

<p>5. Remember, you will be managing this VM yourself, so now is a good time to update the Ubuntu distro. Switch to your Ubuntu distro’s WSL 2 Bash shell:</p>

<div class="language-powershell highlighter-rouge"><div class="highlight"><pre class="highlight"><code><span class="n">wsl</span><span class="w"> </span><span class="nt">--distribution</span><span class="w"> </span><span class="nx">Ubuntu</span><span class="w">
</span></code></pre></div></div>

<p>And run:</p>

<div class="language-bash highlighter-rouge"><div class="highlight"><pre class="highlight"><code><span class="nb">sudo </span>apt update <span class="o">&amp;&amp;</span> <span class="nb">sudo </span>apt upgrade
</code></pre></div></div>

<p>Next, install Docker manually by setting up Docker Engine and launching <code class="language-plaintext highlighter-rouge">dockerd</code>. Refer to the complete official <a href="https://docs.docker.com/engine/install/ubuntu/">guide for Ubuntu</a> if you get stuck, but the steps below should get you started.</p>

<h2 id="setting-up-the-docker-repository">Setting up the Docker Repository</h2>

<p>Continue in your VM Bash shell.</p>

<p>1. Install packages to allow apt to use a repository over HTTPS:</p>

<div class="language-bash highlighter-rouge"><div class="highlight"><pre class="highlight"><code><span class="nb">sudo </span>apt-get <span class="nb">install</span> <span class="se">\</span>
    ca-certificates <span class="se">\</span>
    curl <span class="se">\</span>
    gnupg <span class="se">\</span>
    lsb-release
</code></pre></div></div>

<p>2. Add Docker’s official GPG key:</p>

<div class="language-bash highlighter-rouge"><div class="highlight"><pre class="highlight"><code>curl <span class="nt">-fsSL</span> https://download.docker.com/linux/ubuntu/gpg | <span class="nb">sudo </span>gpg <span class="nt">--dearmor</span> <span class="nt">-o</span> /usr/share/keyrings/docker-archive-keyring.gpg
</code></pre></div></div>

<p>3. Use the <em>stable</em> repository:</p>

<div class="language-bash highlighter-rouge"><div class="highlight"><pre class="highlight"><code><span class="nb">echo</span> <span class="se">\</span>
  <span class="s2">"deb [arch=</span><span class="si">$(</span>dpkg <span class="nt">--print-architecture</span><span class="si">)</span><span class="s2"> signed-by=/usr/share/keyrings/docker-archive-keyring.gpg] https://download.docker.com/linux/ubuntu </span><span class="se">\</span><span class="s2">
  </span><span class="si">$(</span>lsb_release <span class="nt">-cs</span><span class="si">)</span><span class="s2"> stable"</span> | <span class="nb">sudo tee</span> /etc/apt/sources.list.d/docker.list <span class="o">&gt;</span> /dev/null
</code></pre></div></div>

<h2 id="installing-docker-engine-on-the-wsl-2-vm">Installing Docker Engine on the WSL 2 VM</h2>

<p>Continue in your VM Bash shell.</p>

<p>1. Update the apt package index next:</p>

<div class="language-bash highlighter-rouge"><div class="highlight"><pre class="highlight"><code><span class="nb">sudo </span>apt-get update
</code></pre></div></div>

<p>2. For this example, install the latest version of Docker Engine and <code class="language-plaintext highlighter-rouge">containerd</code> with the following command:</p>

<div class="language-bash highlighter-rouge"><div class="highlight"><pre class="highlight"><code><span class="nb">sudo </span>apt-get <span class="nb">install </span>docker-ce docker-ce-cli containerd.io
</code></pre></div></div>

<p>3. Test it with the following command:</p>

<div class="language-bash highlighter-rouge"><div class="highlight"><pre class="highlight"><code><span class="nb">sudo </span>docker run hello-world
</code></pre></div></div>

<p>You have now manually installed the Docker Engine on an Ubuntu WSL 2 VM. However, since you’re managing it yourself, there’s still more to do.</p>

<h2 id="additional-setup-and-challenges">Additional Setup and Challenges</h2>

<p>To manage Docker as a non-root user, rather than using <code class="language-plaintext highlighter-rouge">sudo</code> to run Docker commands, you must create a group, add a user, and possibly modify some file permissions. I won’t go through the details here, but you can follow the <a href="https://docs.docker.com/engine/install/linux-postinstall/">post-installation steps for Linux</a> if you’ve got the time to do a proper job.</p>

<p>The post-installation steps also offer guidance on other challenges you might face while managing your own Docker VM, such as:</p>

<ul>
  <li>Configuring Docker to start on boot</li>
  <li>Logging</li>
  <li>Accepting connections to Docker daemon from remote hosts</li>
  <li>Configuring remote access</li>
  <li>Enabling IPv6</li>
  <li>Fixing IP forwarding problems</li>
</ul>

<h2 id="troubleshooting-cannot-connect-to-the-docker-daemon">Troubleshooting: Cannot Connect to the Docker Daemon</h2>

<p>You were warned - Docker Engine and WSL 2 VM setup is a complex operation to take on. You’re now the admin of a Linux system and responsible for solving any problems. For example, you may have received the following error when you tried to run <code class="language-plaintext highlighter-rouge">hello-world</code>:</p>

<p><img src="/assets/images/docker/dockerconnect.png" alt="Cannot connect to the Docker daemon" /></p>

<p>You received this error because you are not working with a Debian-based distribution and must start the Docker service manually using <code class="language-plaintext highlighter-rouge">systemctl</code> or the <code class="language-plaintext highlighter-rouge">service</code> command. You probably won’t have <code class="language-plaintext highlighter-rouge">systemctl</code> out-of-the-box with the Ubuntu WSL distro, so use the service command:</p>

<div class="language-bash highlighter-rouge"><div class="highlight"><pre class="highlight"><code><span class="nb">sudo </span>service docker start
</code></pre></div></div>

<p>When you rerun the <code class="language-plaintext highlighter-rouge">hello-world</code> test, you should now get a <code class="language-plaintext highlighter-rouge">“Hello from Docker!”</code>.</p>]]></content><author><name>Ben Hall</name></author><category term="Containers" /><category term="Docker" /><category term="WSL" /><summary type="html"><![CDATA[An alternative using WSL 2, where Docker Desktop is not available to you in Windows]]></summary></entry></feed>