
OpenTelemetry, The Missing Ingredient
- Part 1: The Modern Observability Problem
- Part 2: OpenTelemetry, The Missing Ingredient
In Part 1, we looked at the observability challenges for modern systems - microservices, composable architectures, event-driven, shared components - all that good stuff solving problems well. But they’re really hard to support. We emphasised the importance of the right data being instrumented and we concluded that there are many good observability solutions, both open-source and commercial. But they all do things their own way, greatly reducing our ability to flex and adapt - letting our old opponent vendor lock-in through the door.
In this article, we’ll look at how OpenTelemetry bridges the gap between our code and the observability backend options, supporting a move away from vendor-specific tooling for generating and exporting telemetry data.
A Quick Refresher
Before we get started, let’s refresh our terminology from Part 1:
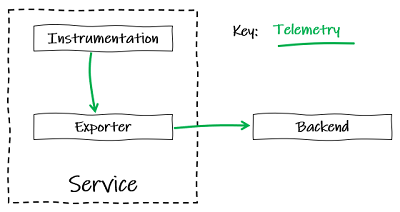
- Instrumentation is what produces the telemetry. When we talk about instrumenting, we mean to add libraries and/or code to our applications to collect telemetry such as logs, metrics and traces.
- Telemetry are insights into the behaviour or inner workings of a system – the data that the system emits about what’s happening inside the ‘black box’, collected via instrumentation. You may also hear these being called signals.
A Vendor-Neutral Standard
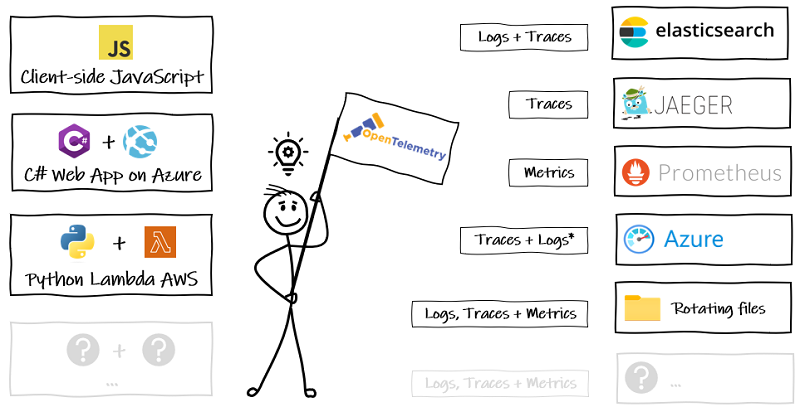
At its core, OpenTelemetry (OTel) is a vendor-neutral standard for telemetry across languages. You only need to instrument your code once and can then easily change to other observability backends when your needs change.
It is also means you can stick with your backend of choice while being able to change the language you use - all supported languages will adhere to the same API specification for instrumentation.
More Than A Vendor-Neutral Standard
OTel also provides a complete end-to-end implementation for generating, emitting, collecting, processing and exporting telemetry data to any supported observability back-end. For each language currently supported there core libraries, automatic instrumentation libraries, and exporters.
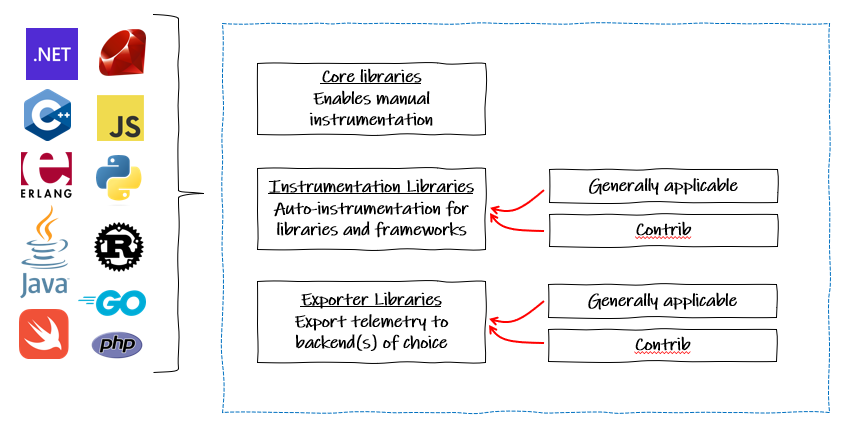
Core libraries
The API is the bare bones interface for instrumentation - no actual telemetry data will be sent to a backend. It’s been done this way because third party libraries wishing to instrument their code should not need to be concerned with how the consuming application implements its OpenTelemetry.
The SDK is the complete language library that provides implementations of the API so we can instrument our code manually. It is what we pull directly into our applications. It doesn’t implement exporters, which are separate libraries that take a dependency on the SDK. Alternative instrumentation are available in separate libraries implementing the API.
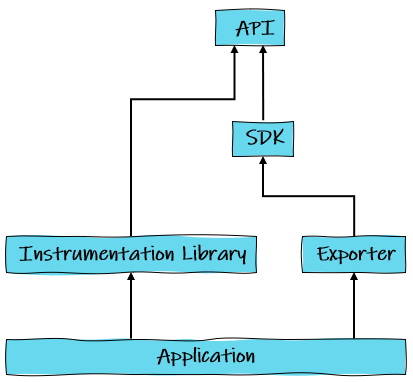
Typically, any application that we wish to hook up to a observability backend with OTel will take dependencies on both of these indirectly, through dependencies on instrumentation libraries and exporters.
Instrumentation Libraries
Plugin-and-go for many common libraries and frameworks, such as those for web and databases. For example, we can generate telemetry data automatically for ASP.NET Core incoming web requests and outgoing Entity Framework requests. The only steps required are adding the two packages:
- OpenTelemetry.Instrumentation.AspNetCore
- OpenTelemetry.Contrib.Instrumentation.EntityFrameworkCore
And adding them as services in code:
 public void ConfigureServices(IServiceCollection services)
{
    services.AddOpenTelemetryTracing((builder) => builder
        .AddAspNetCoreInstrumentation()
        .AddEntityFrameworkCoreInstrumentation()
        // Add your exporter(s) here
    );
}
The OTel project maintains instrumentation and exporter packages for key OSS projects and compliance with the OTel specification, in its main repository for each language. For .NET this is open-telemetry/opentelemetry-dotnet. Many others are then available from a sister contrib repository, which for .NET is open-telemetry/opentelemetry-dotnet-contrib.
Exporters
Exporters are libraries to send the instrumented telemetry data to backends. This can be through the OpenTelemetry Protocol (OTLP) itself - and that is the long-term goal*, or vendor-specific such as Jaegar or Azure Monitor, where the exporter library would translate from the OpenTelemetry data in memory, to the format used by a vendor tool. The availability of these types of exporters makes it much easier to plan and execute a transition to OTLP.
*Vendors are increasingly offering full support for direct ingress of native OTLP. See this list for updates. The Jaeger docs now even state:
As of 2022, the Jaeger SDKs are no longer supported, and all users are advised to migrate to OpenTelemetry.
Vendor-Neutral Tracing
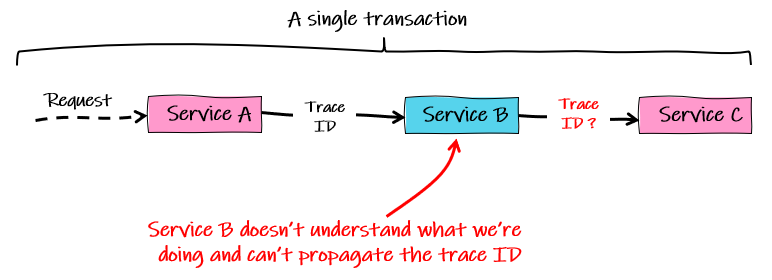
One of the biggest challenges I’ve faced when debugging distributed systems is getting visibility the complete end-to-end journey of a transaction through all the services involved.
In part 1 we introduced distributed tracing as a key part of any observability solution to solve just this problem. We acknowledged that there are many open-source and commercial products that do this already by propagating a trace ID between all operations in a transaction to tie everything together.
But more often than not, we end up with an incomplete picture that the business just accept as a risk, despite the increased effort for support. Some common causes of this include:
- Services on mixed tech stacks require different solutions and resource constraints prevent us from instrumenting all of them
- Vendor lock-in, where our chosen backend does not support the tech stack of some of our services
- Clients and agents to instrument and send telemetry are built in-house and resource constraints prevent us from maintaining them for all service tech stacks
As a single standard for tech stacks and backends, OTel eliminates these challenges. It brings a complete set of tools that really do simply plug in, to greatly reduce the resourcing required, and because it is an open standard, very little resources are required to switch to (or add) other backends.
How OpenTelemetry Does Tracing
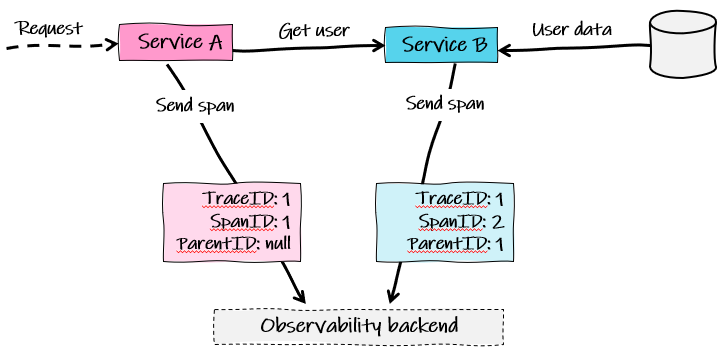
OTel represents each operation in a trace across a system with the concept of a span. Amongst other things defined in the OTel specification, each span will hold:
- A unique trace ID for the whole ‘journey’ of the current transaction through the system
- A unique ID for the span itself
- A unique ID for the parent span so we can reconstruct the journey in an observability backend
Each span represents a single operation in the overall transaction through a system. Most backends will represent these against time, in a way you might be familiar with from Gantt charts.
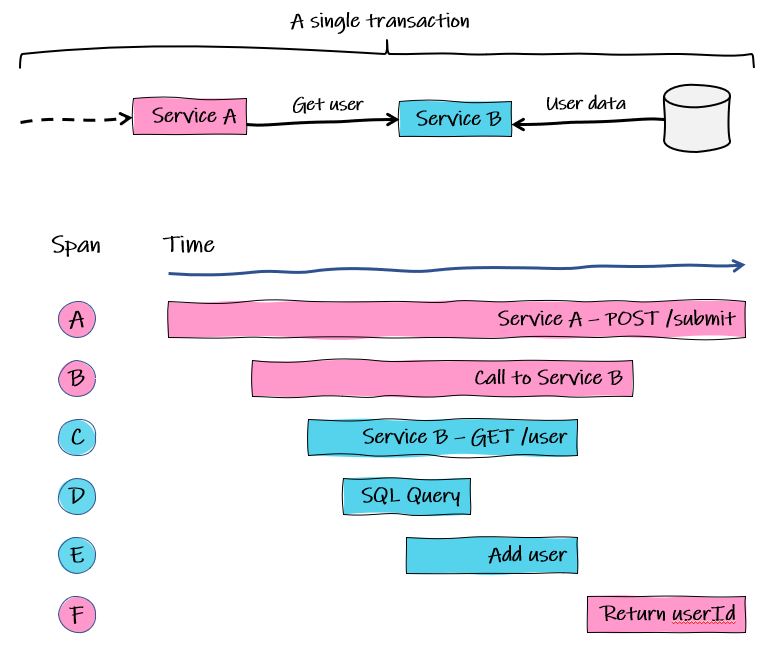
In this simplified example:
- Span A: request comes into Service A for user details. This is the root span and of course, parent to span B. Most mainstream web frameworks will be able to auto-instrument this, meaning it will automatically create a trace span for this incoming request.
- Span B:Service A calls Service B to get a user’s details. We might get this from a library to auto-instrument HTTP calls or we could manually add a trace signal ‘around’ the code that makes the call.
- Span C: Service B receives the request.
- Span D: Inside the code to handle the request, a child span represents an SQL query to the database for the user details.
- Span E: We manually instrument a signal for adding then user if it is not found.
- Span F: Service B has returned the user details and Service A returns that data to the caller, which is auto-instrumented by our web framework.
Vendor-Neutral Context Propagation
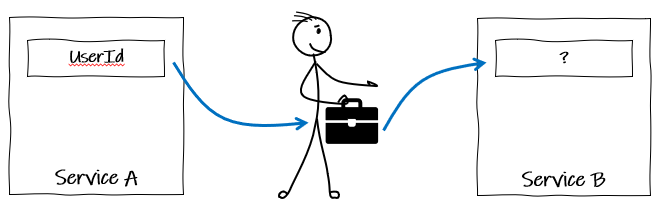
OTel uses the concept of baggage, which standardises the format of a shared context for values across programming languages and platforms, removing the need for teams to develop their own custom solutions for propagating shared data.
For example, if only service A sees a user’s ID, we could put in the baggage so that service B could access in when called as a child/dependency.
The Collector: A Vendor-Neutral Proxy
The star of the show in my opinion, is the collector. While most languages have exporters to send telemetry data directly to back-ends, which is fine during development, it is beneficial to offload data quickly to a collector to handle the resource intensive tasks, such as:
- Exporting to multiple places
- Enhancing with metadata
- Batching
- Encryption
- Buffering and retries when the back-ends are unresponsive
- Control flow to back-ends to allow service to continue its work
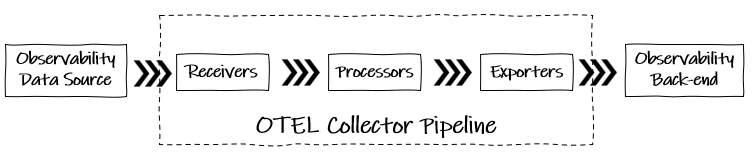
The collector can receive and export data in multiple formats, to and from observability tools using the OpenTelemetry Procotol (OTLP) and proprietary ones. It does his by acting as a pipeline through receivers, processors and exporters.
Receivers
Receivers are how telemetry signals are ingressed from sources into the collector before being processed and sent on to observability backends.
The core receiver is for telemetry using OTLP but there are many more available from the contrib repository to support vendor formats and translate these to OTLP:
- A file log receiver that will tail and parse logs from files.
- A Jaeger Receiver, if you have an existing services exporting traces to Jaegar, these can be redirected to your collector and exported to new backends alongside the existing Jaegar instance.
- A Kubernetes cluster receiver that collects cluster-level metrics from the k8s API server.
Processors
Processors can be run on data between receiving and exporting. Some examples:
- A redaction processor that can be configured to prevent sensitive information leaking into traces.
- A k8s attributes processor that can automatically tag telemetry passing through the collector with k8s metadata.
- A batch processor to reduce the number of outgoing connections used to transmit to backends.
Exporters
Similar to the libraries used directly by applications, these are used to send data to observability backends or other destinations from the collector.
As well as the core OTLP exporter, there are many available from the contrib repository
The Sidecar Pattern
Below is a snapshot of a typical use-case. We have a .NET web app exporting logs, metrics and traces using OTLP to a collector. It also shows how we might choose to transition while continuing to output file logs, pulling them into the collector using the file log receiver.
This method of deployment depicted is where a collector is deployed alongside each service on a one-to-one basis, with a shared lifetime with the service. This tends to put ownership of the collector with the development team(s) and is useful if you need to do processing specific to a service.
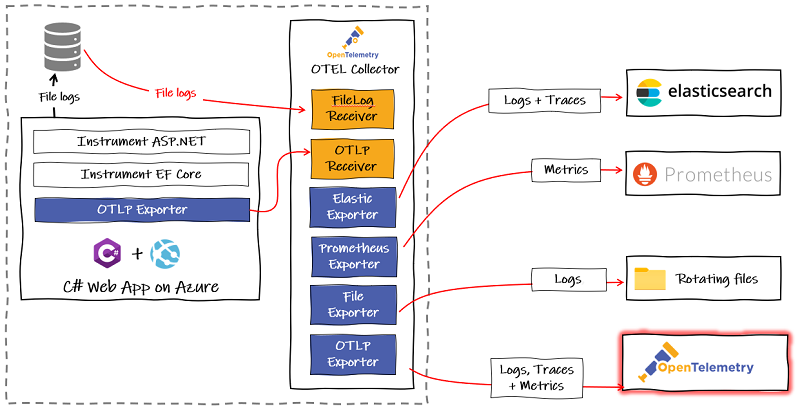
Our collector could then be setup as a pipeline to export those to the back-ends of our choosing.
The configuration for that pipeline would like this (complete config file):
service:
  pipelines:
    traces:
      receivers: [otlp]
      exporters: [otlp, elasticsearch/trace]
    logs:
      receivers: [otlp]
      exporters: [otlp, elasticsearch/log, file/rotation_with_default_settings]
    metrics:
      receivers: [otlp]
      exporters: [otlp, prometheus]
As a Single Gateway
It’s also possible to deploy the collector as standalone gateway component, to be scaled independently of the services. This tends to mean ownership of the collector is with platform teams who can then centrally manage policies and permission.
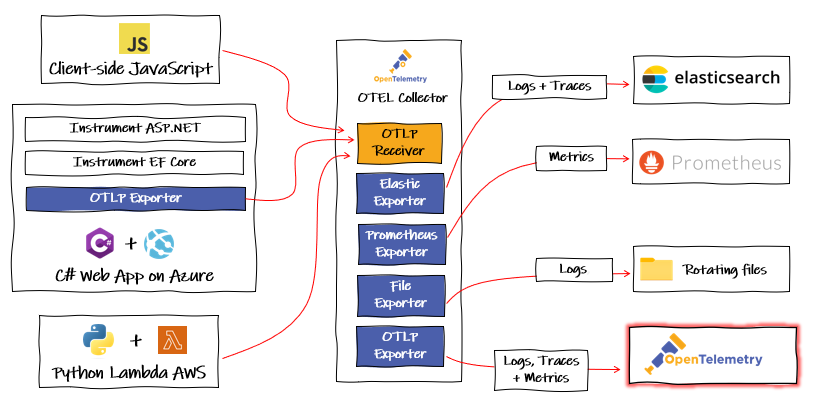
The ideal setup is for each service or collection of services to have dedicated collectors as agents, owned by the development team. These would export to an instance run as a gateway by the ops teams to apply their own processes such as authentication or metadata.
Summary
Observability solutions, both open-source and commercial, have done a good job in catching up with the demands of supporting complex modern architectures. The big unsolved problem was the lack of standards, which reduced our ability to flex and adapt, resulting in some level of vendor lock-in.
OpenTelemetry is the missing ingredient, which is set to change the landscape significantly. It is very easy to adopt with a real plug-and-play feel to it, and there is good transition support with libraries to translate between proprietary protocols and OpenTelemetry.
For the .NET readers, fire up my demo repository and have a go at using OpenTelemetry with .NET and Azure Monitor.
EDIT April 2023: Listen to me on the Day Two Cloud, a Packet Pushers podcast, talking about OpenTelemetry. Use this direct link or listen on your favourite podcast platform via pod.link.
Comments