
The Modern Observability Problem
- Part 1: The Modern Observability Problem
- Part 2: OpenTelemetry, The Missing Ingredient
Debugging an application in a single process tends to be easy 💪 and most of what goes wrong with our monoliths will already be recorded as known problems, with standard solutions. We may even have automated their fixes. But if not, we know there are finite routes through the application, and that tracing the cause of most problems is relatively trivial.
But the complexity of interactions in large, modern microservice architectures produces novel, one-off errors, that cross boundaries in space and time. Factor in components being built on a broad mix of tech stacks, and we have a proper challenge supporting them.
Imagine just a small number of services like those represented in the diagram below. We have a mix of synchronous REST communication and asynchronous* events. If we get an error in service H because of something that happened in service B, this would be non-trivial to investigate - without the right information.
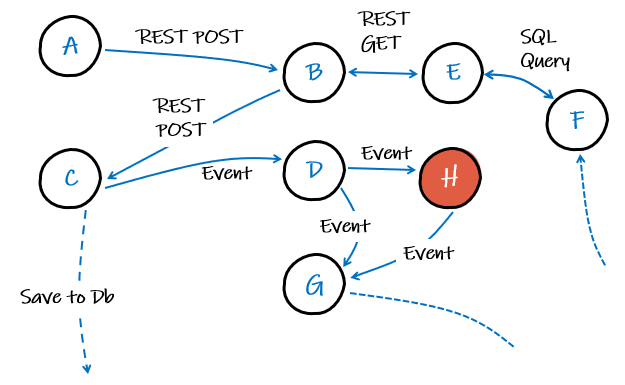
* Synchronous HTTP calls will request and receive a response at the same time. Of course sometimes it might take a few seconds, but quick enough so that we can easily link it to any side effects it might have. Asynchronous communications, like events, won’t necessarily trigger an instant response. It could even be a day before an event added to some queue is processed! Clearly, it won’t be as easy to assign blame for some side effect to an event.
Visibility is not Observability
Observability and monitoring are two different things. We’re usually pretty good at monitoring, or if that fails, the users will shout at us. Either way, we tend to know when there is a problem. We don’t always do so well at answering the why questions.
That, for me, is the core observability problem: Why is the system exhibiting this behaviour?
And if you’re doing observability right, you should be able to answer that question without having to redeploy with additional logs or ‘prints’.
If you can only answer questions about predictable problems - that’s monitoring, not observability.
Telemetry and the Three Pillars of Observability
- Your car dashboard displaying how much fuel is left in the tank
- When you filter log output from your code in a tool like Kibana
- When you’ve looked at a histogram of events passing through your servers
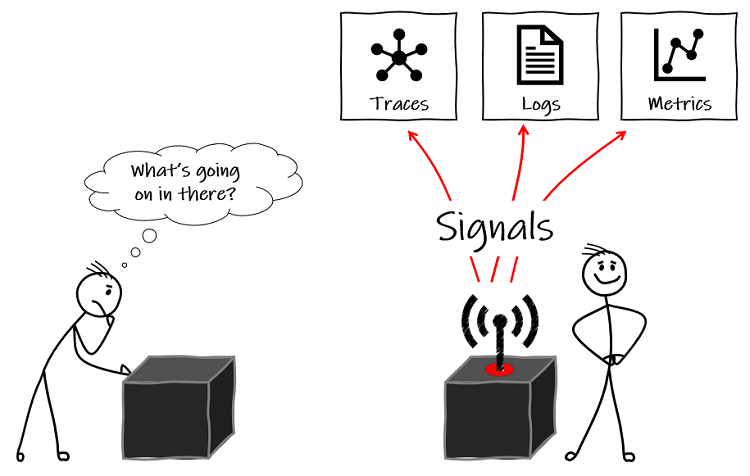
These are all examples of telemetry – insights into the behaviour or inner workings of a system – the data that the system emits about what’s happening inside the ‘black box’. You may also hear these being called signals.
And instrumentation is what produces the telemetry. When we talk about instrumenting, we mean to add libraries and/or code to our applications that collects telemetry such as logs, metrics and traces.
In software engineering, we often to simplify telemetry to three distinct things:
Logs: More specifically, centralised logging – shipping all the text log entries from our components to a single data source to easily draw correlations with searches. Logs typically describe in some detail, what is happening, so are expensive to store a long time. They are not always tied to a specific user/request and thus lack context, but nonetheless, are still heavily relied on to understand system behaviour.
Metrics: Typically focusing on reliability, the type of stuff discussed for service level indicators (SLIs) and service level agreements (SLAs). As they are largely numerical data like counters and rates, they use significantly less storage than logging. This means it can be kept for longer, allowing for better analysis of trends over time. Caution though, size can increase with complexity – the cardinality – how much extra data we attach to each metric to make them more useful.
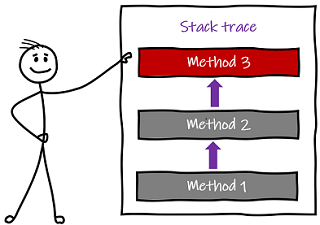
Traces: More specifically, distributed tracing. Think of this as a stack trace across multiple components (and boundaries) of a distributed or large system. It offers some of the analytical benefits of metrics but with the cardinality of logging. Distributed tracing also relies on context propagation, a component to move shared information and identifiers used to associate traces, between the services.
With tracing instrumented across all our services, properly correlated with logs, then in our fictional system we could see the route our imaginary transaction has taken, leading us to the problem service(s), which in our imagined scenario, is some dodgy data in service F and the code in service B not gracefully handling it, such that the error didn’t surface until service H.
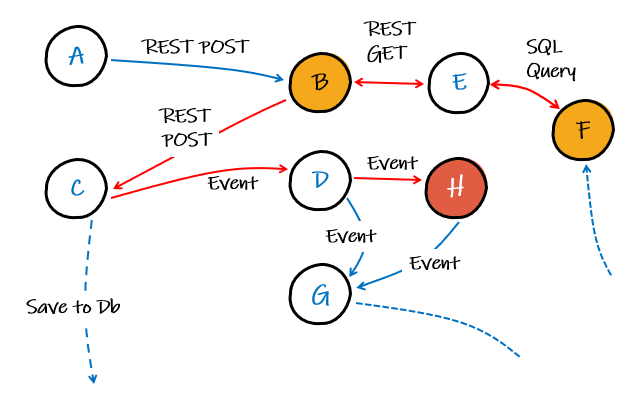
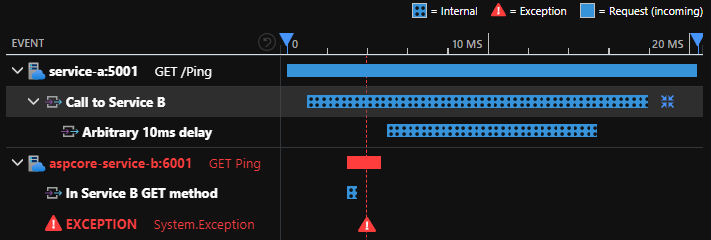
A typical observability tool view of traces and logs, if an exception was thrown in service B after it was called from service A would be like the image below. With it, we can see exactly what call from service A made the request and drill down into it further to see associated logs and get a complete picture of the overall transaction.
We’ll look at traces in more detail for part 2, on OpenTelemetry.
Ultimately, logs, metrics, and traces are the well-established ‘3 pillars’ of observability, but there are others, like health checks. Whichever way we choose to break it down, we often have raw telemetry data in varying formats and structures that need to be processed and correlated to answer questions about the behavior of our system.
What is the Right Telemetry?
Shift away from that monitoring state of mind where you’re looking for problems you can predict, and make sure your system emits enough of the right telemetry to allow you to troubleshoot the problems you cannot foresee, because microservice architectures in a production environment will provide plenty of those! Emitting the right telemetry is what makes a system observable.
What actually stops internal users working or external customers getting what they need done?
What’s the business value of each service?
Keen an open dialogue with your colleagues in the business to understand what questions about the system matter to them. Use this to decide what is the right data to be instrumented.
This turns observability into a more powerful tool that can be use for what..if scenarios and forecasting.
The Technology Problem
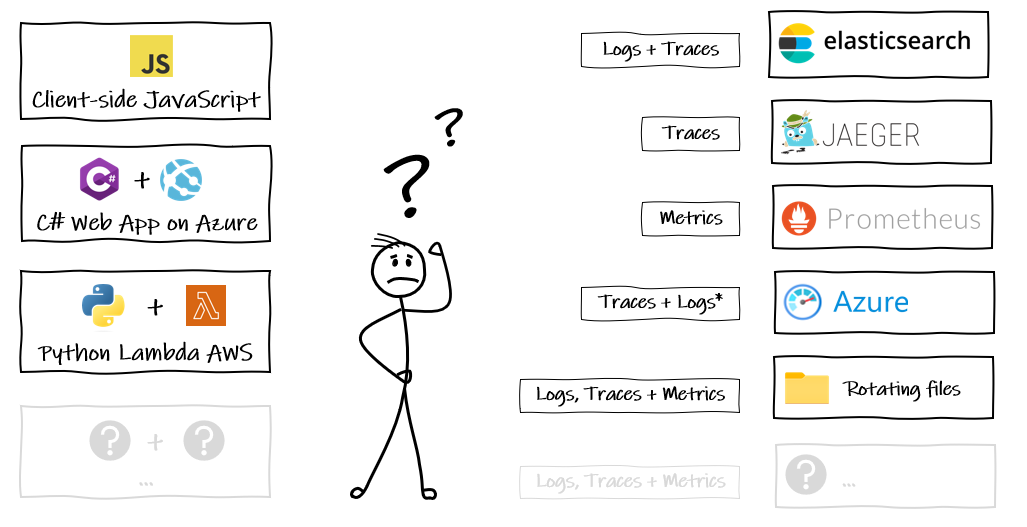
We have our applications built in a mix of technologies (and more) here on the left, doing stuff we want to know about (this is intentionally getting more complicated as we purposefully shift to composed architectures and smaller microservices).
And we have all these options on the right (and more) that we might want to use to collect and analyse what the things on the left are doing.
The reality will be a bit of all of it. Some files, some custom database, maybe one team has gone their own way with elastic on prem., another in the cloud. All emitting telemetry signals but not necessarily in the same format, which means it becomes really difficult to get a joined up picture of what is going on in side the black box. For example:
- You’re not going to be able to aggregate logs and run queries across the system if they’re not using a shared format. I’ve seen log shipping agents written to reformat logs but maintaining the agents and clients to do this, across tech stacks, uses a lot of resources.
- I’ve witnessed confusion between teams, each trying to find out what they should be adding to some common context in a transaction across services owned by a number of teams. A gap that can be easily be filled by establishing a standard but standards take time and effort to build in-house.
Vendor Lock-in
It’s okay to roll our own database or file logging and utilise the abstractions provided by our language frameworks. But at scale, we need the powerful features of dedicated self-hosted or SaaS observability solutions. The problem, is that they instrument code in their own way, which makes it a non-trivial piece of work to switch to a different solution.
We call this ‘vendor lock-in’ and its effects go both ways:
- Our services all depend on the logging solution they are now plumbed into
- The logging solution will only support X and Y tech stacks, limiting our freedom to change these for our services
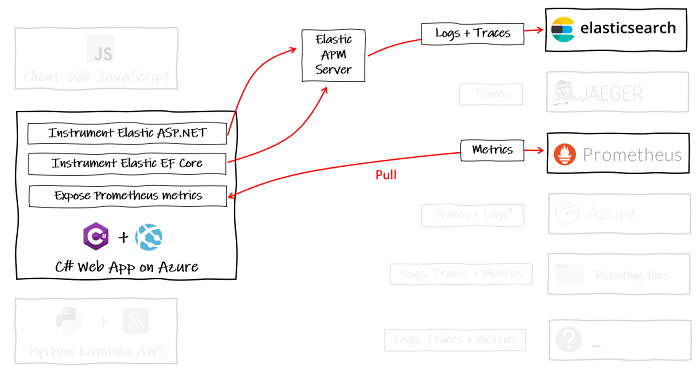
Sure, if you have a handful of C# web applications and that’s all you ever make, then maybe it is okay to lock into specific observability backends:
But we can’t predict the future and we don’t want to create future legacy.
Summary
To resolve problems in a large microservice system:
- We must be able to find out why they have occurred.
- For this, our system must be observable.
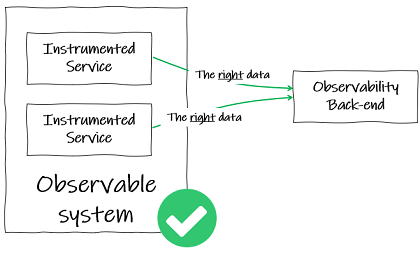
- To be observable, a system needs to be instrumented such that the code emits telemetry, which is typically logs, traces and metrics.
- This telemetry must be sent to a backend that supports joining up that telemetry data and answering questions about the system’s behaviour.
There are lots of open-source and commercial backends, available as self-hosted or SaaS, many of which are really good at this. The problem, is that they all do things in their own ways - there is no standard. Plumbing our logging, metrics and traces into all our services is a big task, meaning when you have done it once for any vendor, you probably won’t be doing it again any time soon, greatly reducing your freedom to be flexible and adapt.
OpenTelemetry (OTeL) is the evolution of ideas from the OpenTracing and OpenCensus projects, to build a single, vendor-neutral standard. We’ll look at this in Part 2: OpenTelemetry, The Missing Ingredient.
EDIT April 2023: Listen to me on the Day Two Cloud, a Packet Pushers podcast, talking about OpenTelemetry. Use this direct link or listen on your favourite podcast platform via pod.link.
Comments